

Find Bottlenecks in Power BI: Lab Results in Healthcare
Find where finished work waits for the next step. Use a simple laboratory example in Power BI to compare task time with waiting time.
A laboratory finishes a test in 30 minutes. Its result then waits five hours before the result check starts. A different test takes 24 hours to develop, then moves to its next step after just ten minutes.
Those delays lead to different business questions: does a task take a long time, or does finished work wait for the next step? Start and end times let you separate the two and choose where to investigate.
In this fictional lab, the team receives a sample, runs a test, checks the result, and sends a report. We will use 78 recorded steps across 14 samples to find where results wait longest and make a short list of examples to check.
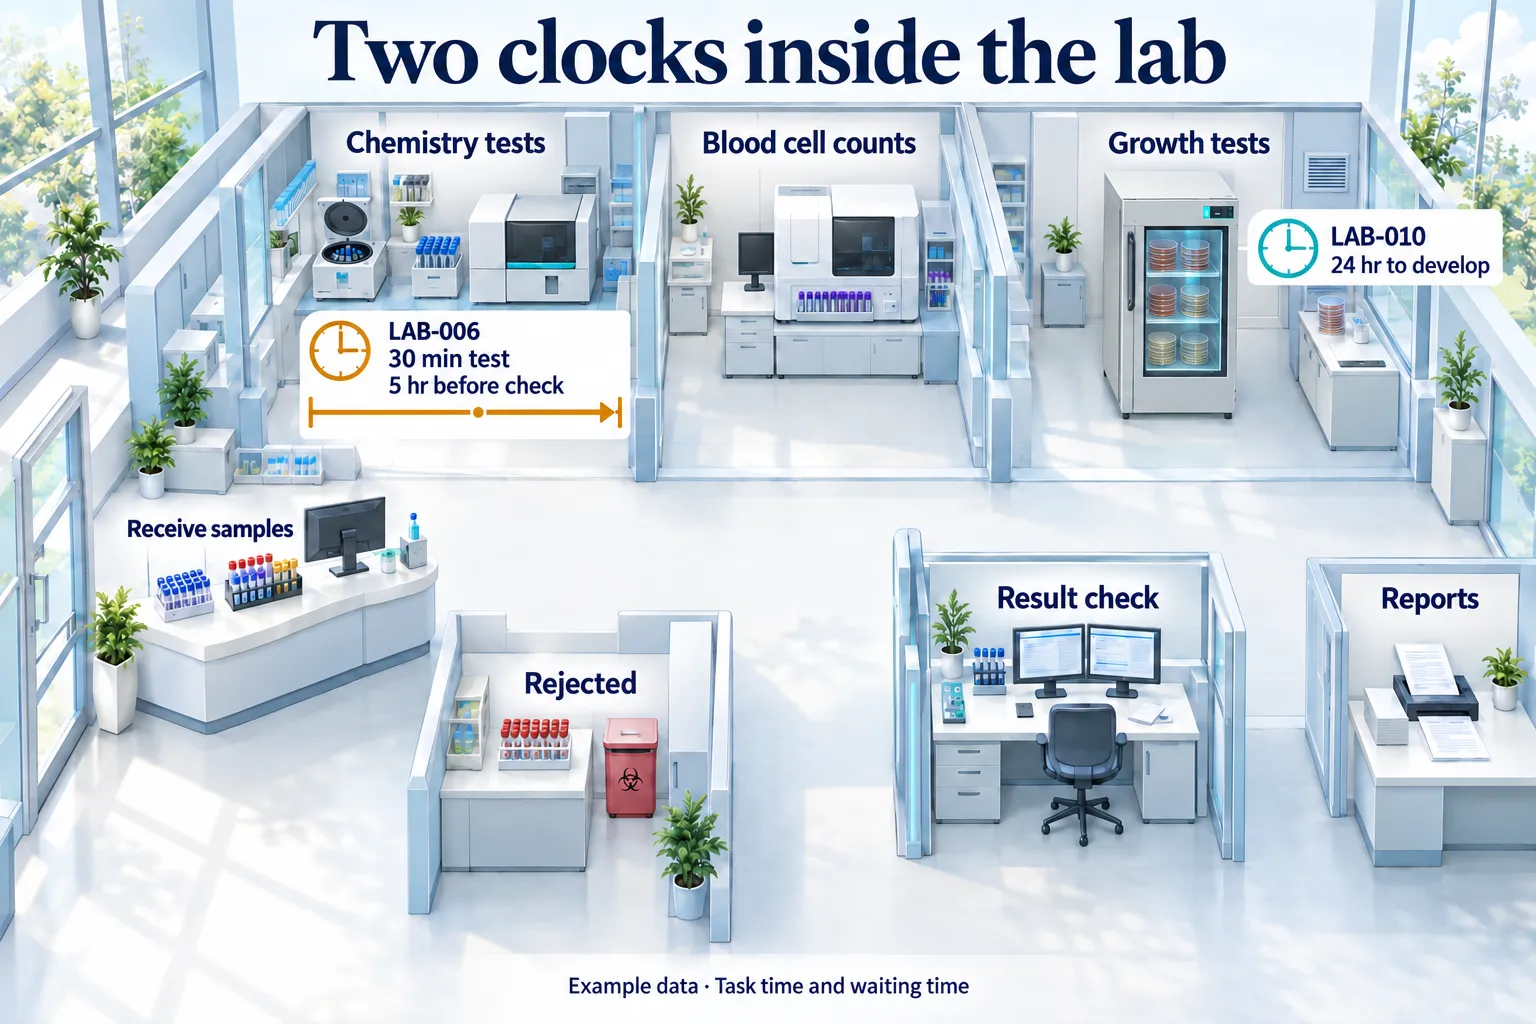
Read the two timing examples
- LAB-006: The chemistry test runs from 08:50 to 09:20. The result check starts at 14:20: thirty minutes of testing, followed by five hours of waiting.
- LAB-010: The test takes twenty-four hours to develop. Reading its result starts ten minutes later.
Load the laboratory sample
Use the first walkthrough’s setup to load the laboratory CSV into Power BI and add Threadseer. Map Case ID, Activity, Timestamp, and the new End Timestamp column to their matching fields, then choose Analyze this selection.
Start with two simple measurements
The sample follows one step at a time. Timestamp tells us when a task starts; End Timestamp tells us when it finishes. In this example, finishing a task means the sample is ready for its next step.
The map has three testing routes: a chemistry test, a blood cell count, and a growth test that needs time to develop before its result can be read. All three lead to Check result, then Send report. A fourth route ends when a sample is rejected before testing.
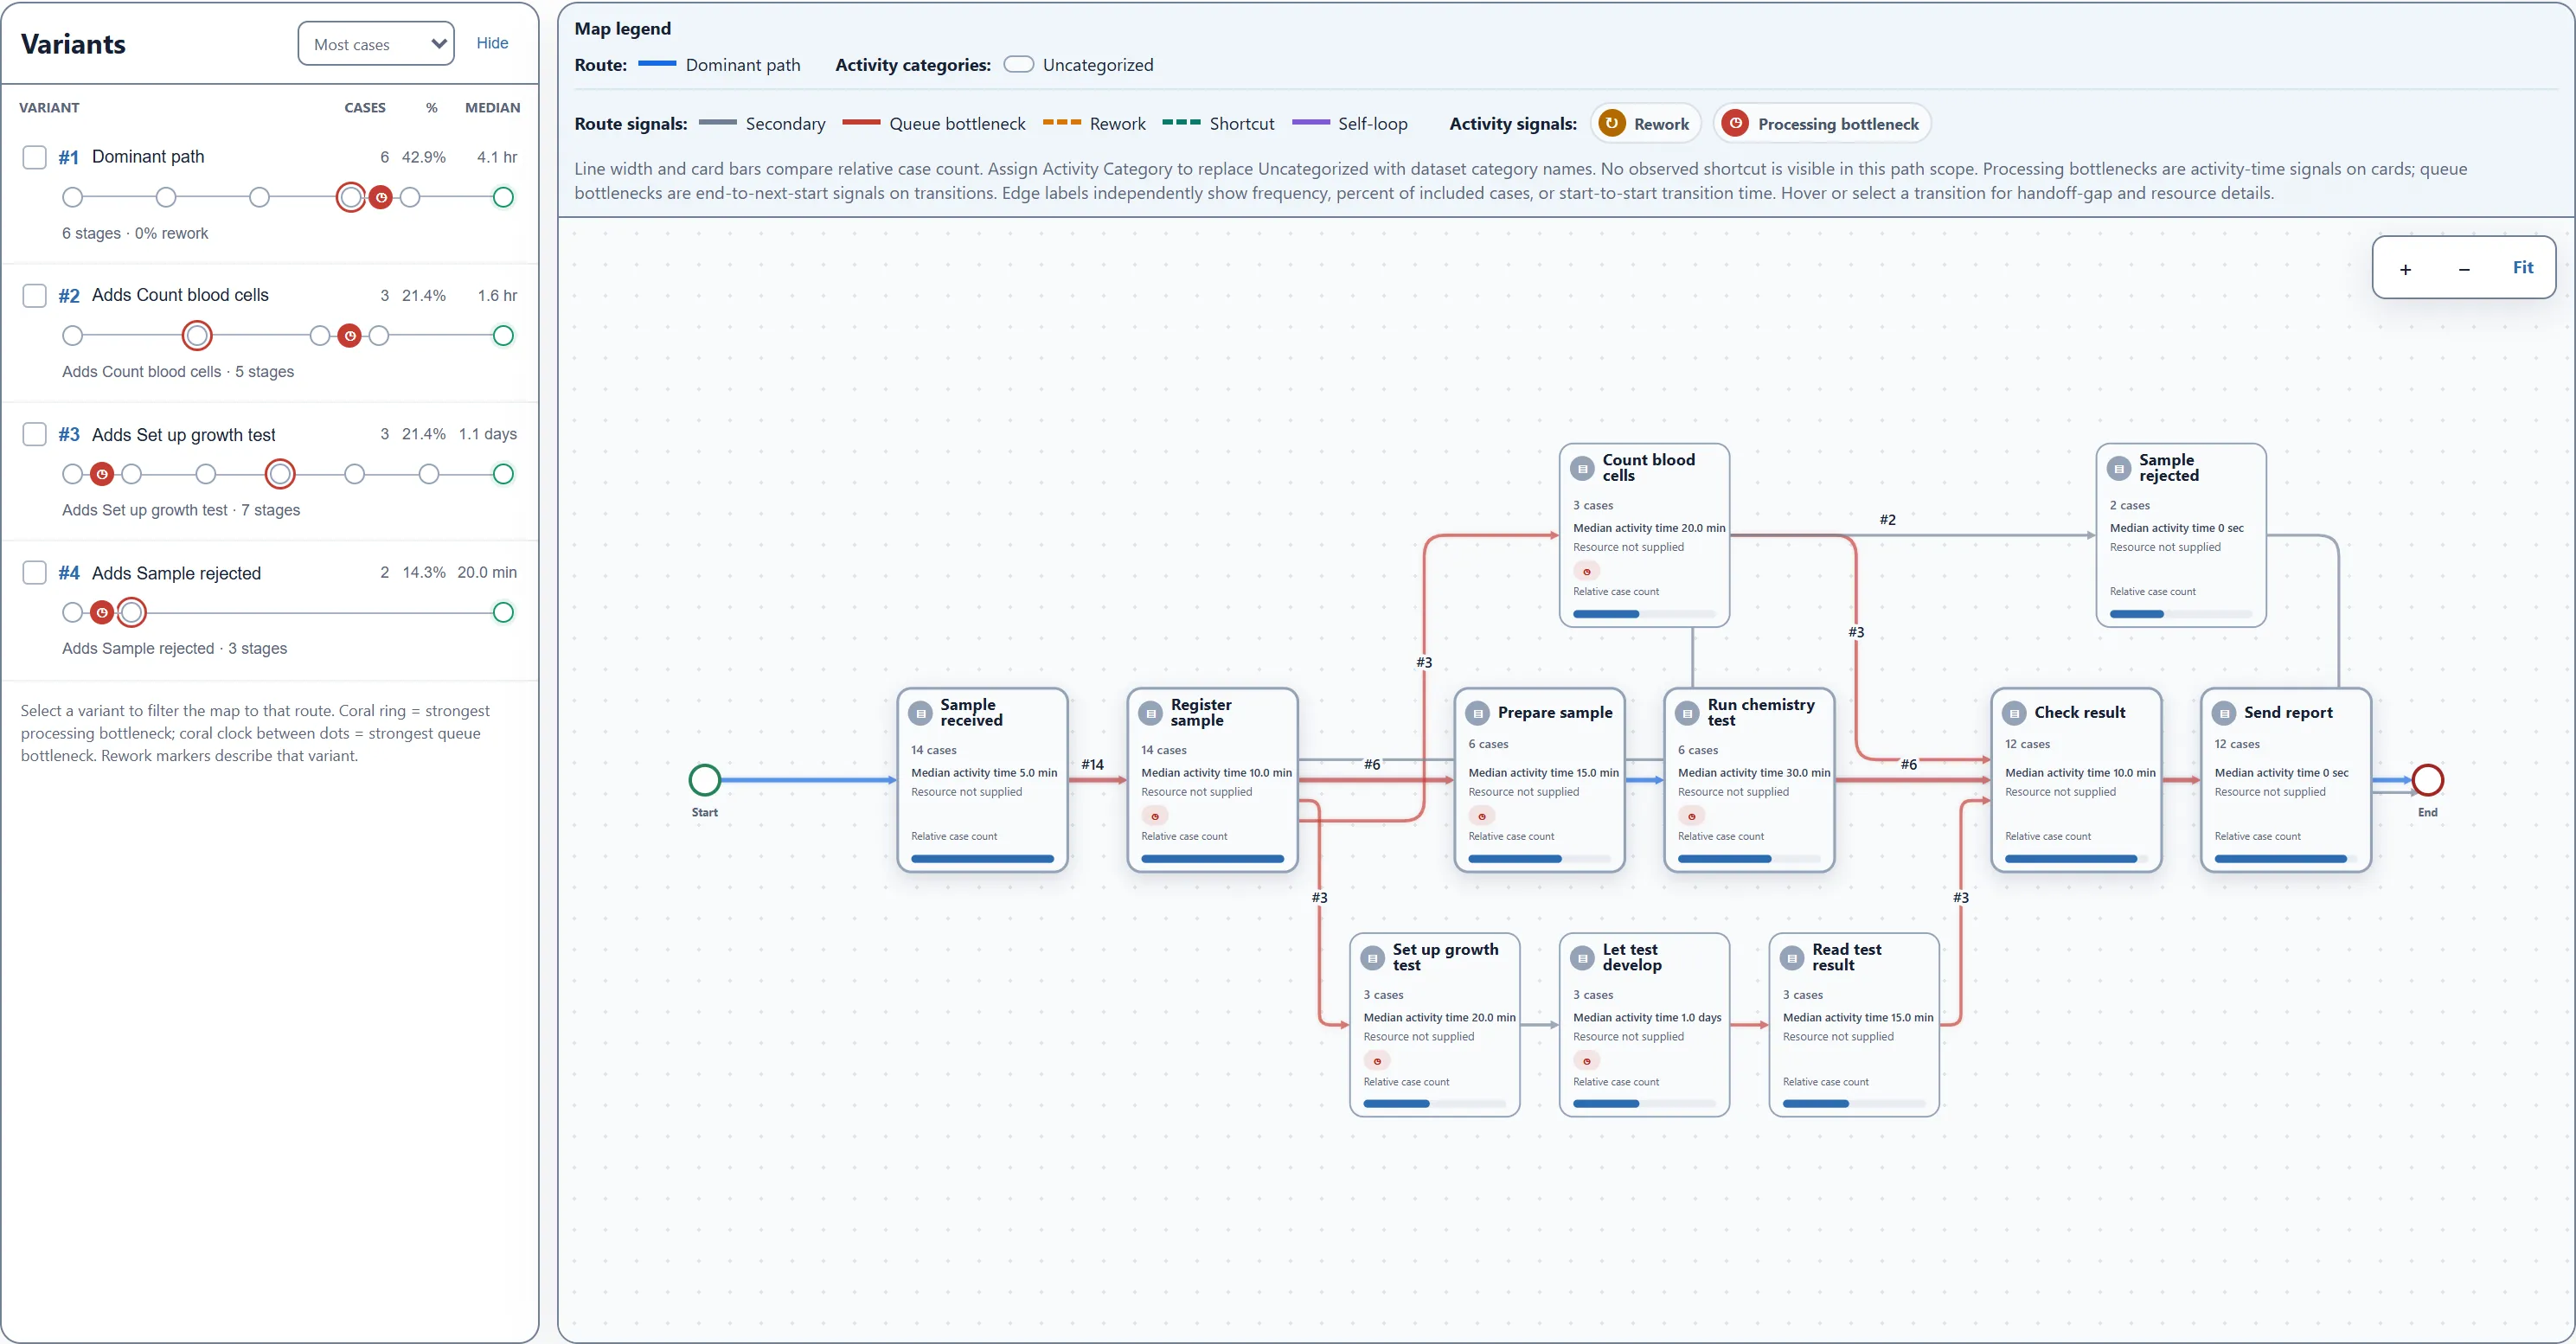
For any two steps that follow each other, calculate:
- Task time
- Task finish − task startThreadseer calls this activity time. Use the task's End Timestamp and Timestamp.
- Waiting time
- Next task start − previous task finishThreadseer calls this queue wait. Use the next task's Timestamp and the previous task's End Timestamp.
The finish time needs to mean ready for the next step. If a result is saved but still needs approval before it can move on, the measured wait includes that approval delay too. Check what “finished” means in your records.
Compare task time with waiting time
Open Bottlenecks. Its first table ranks time spent in tasks; its second ranks waits between tasks. Use Total activity time and Total queue wait, with the largest totals first.
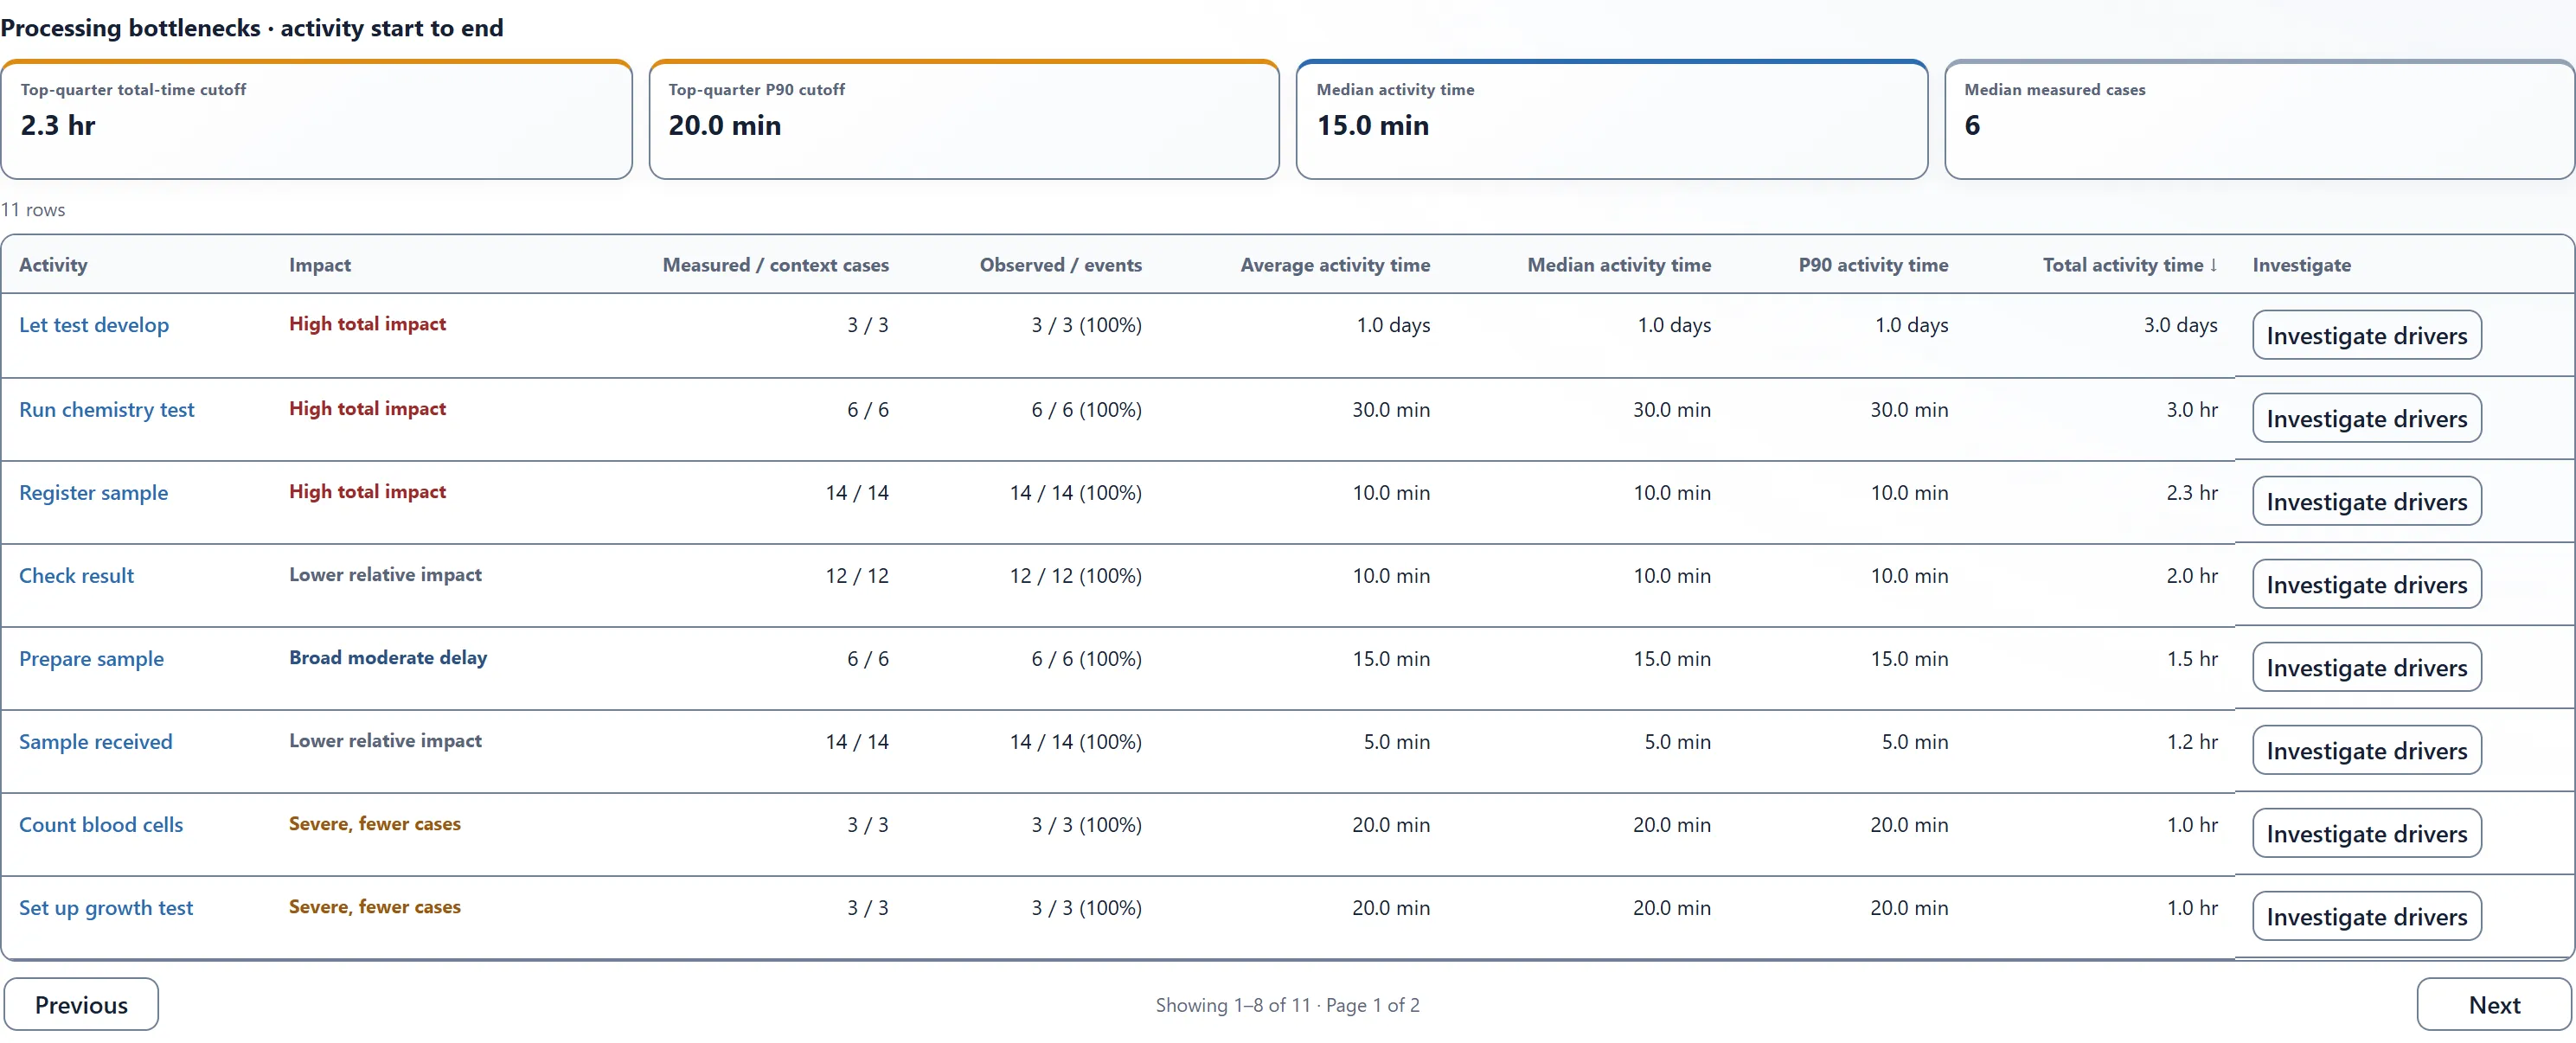
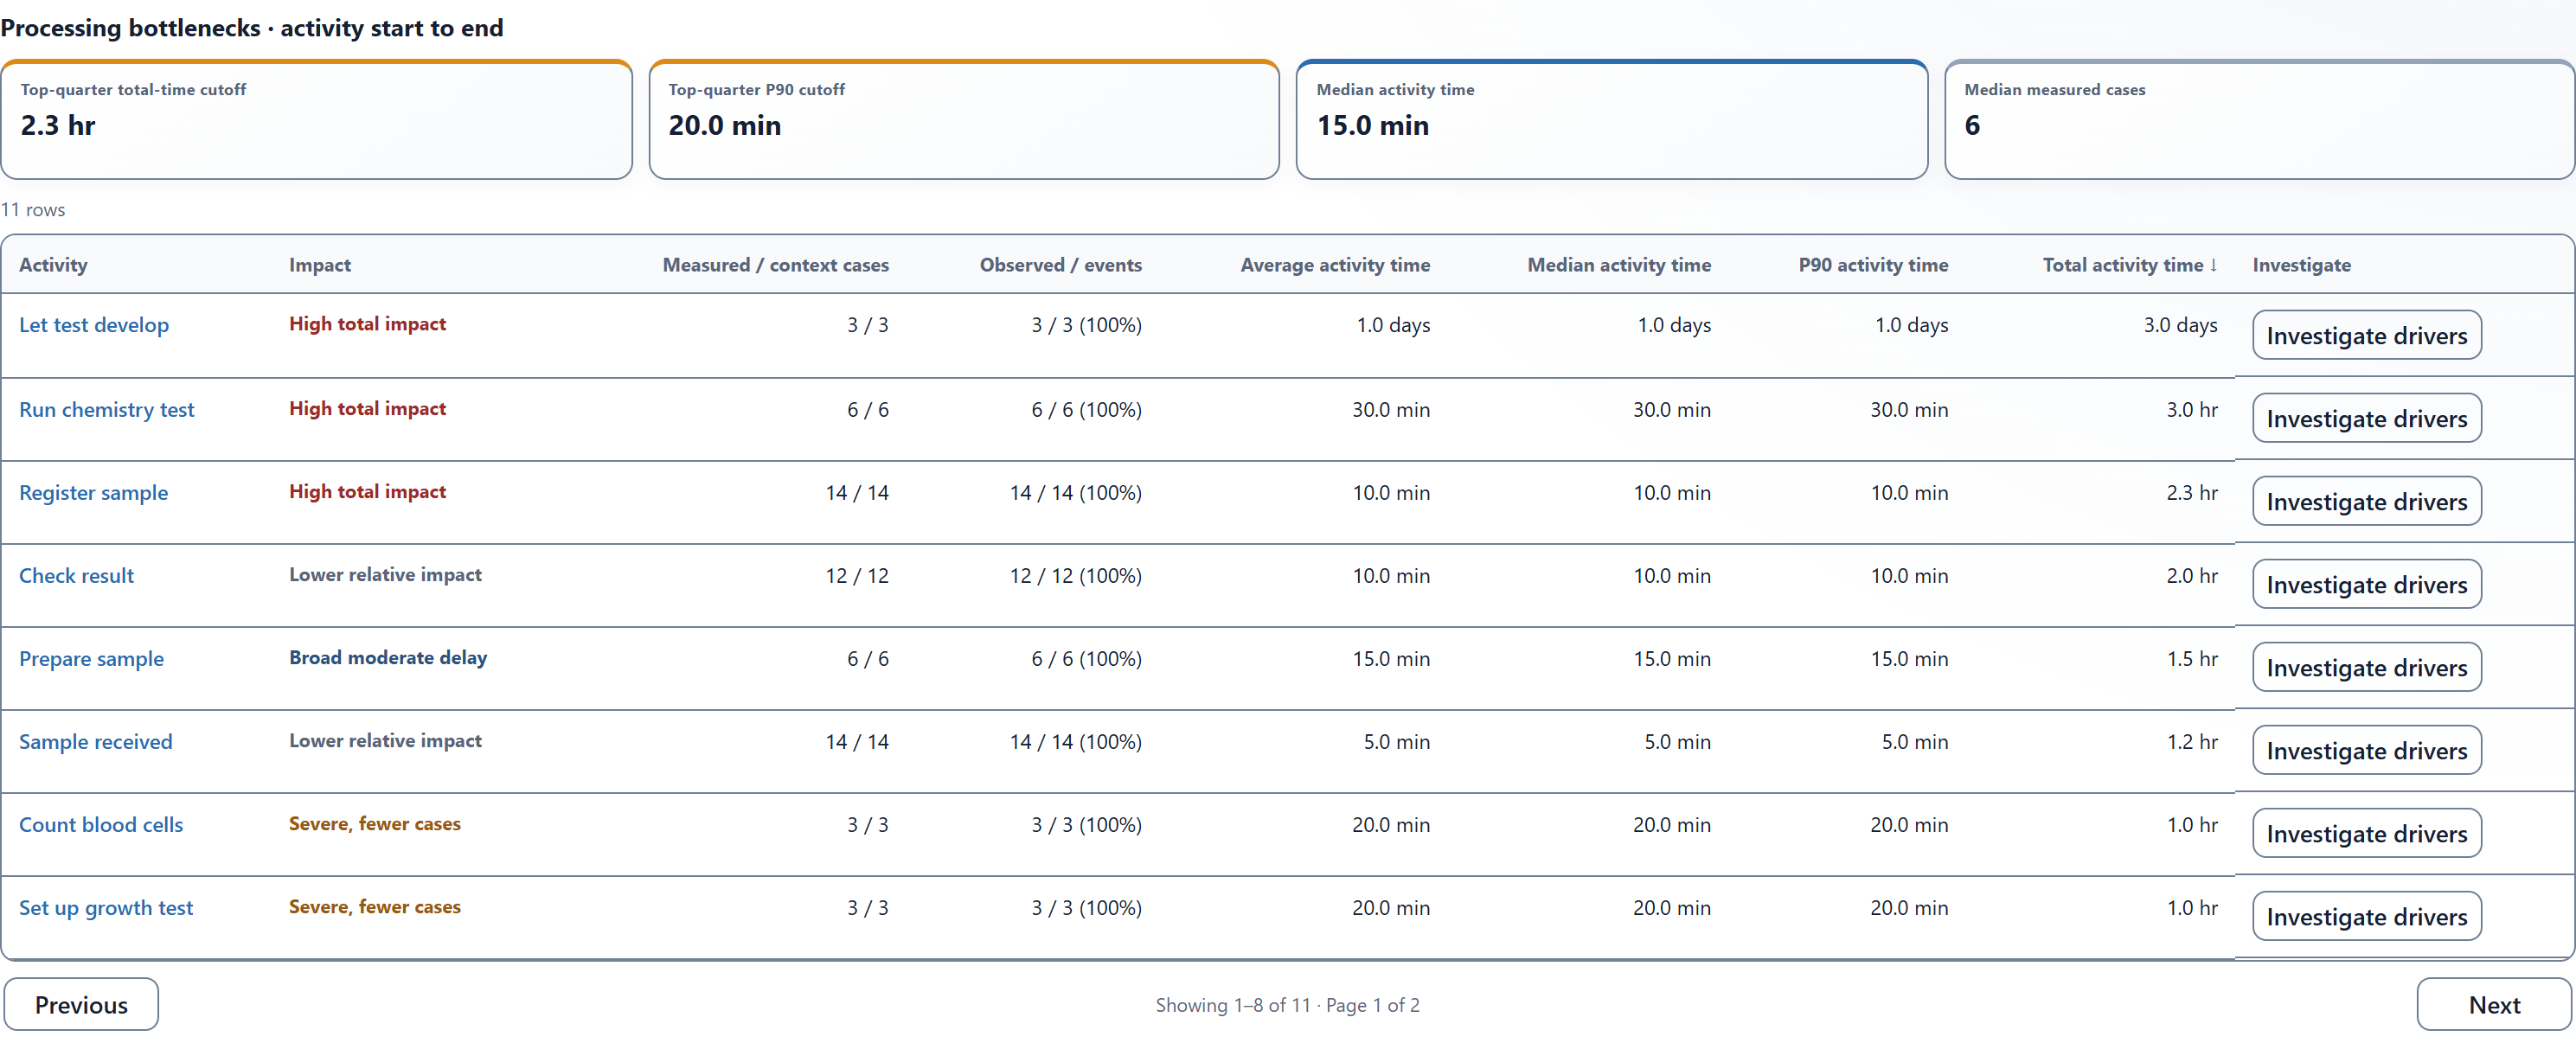
Let test develop is the longest task. In our example, these tests need a full day before the result can be read. That makes the long task worth understanding, but its length alone does not show a problem. The recorded duration also does not tell us how many hours staff worked: a test can develop while staff do other work.
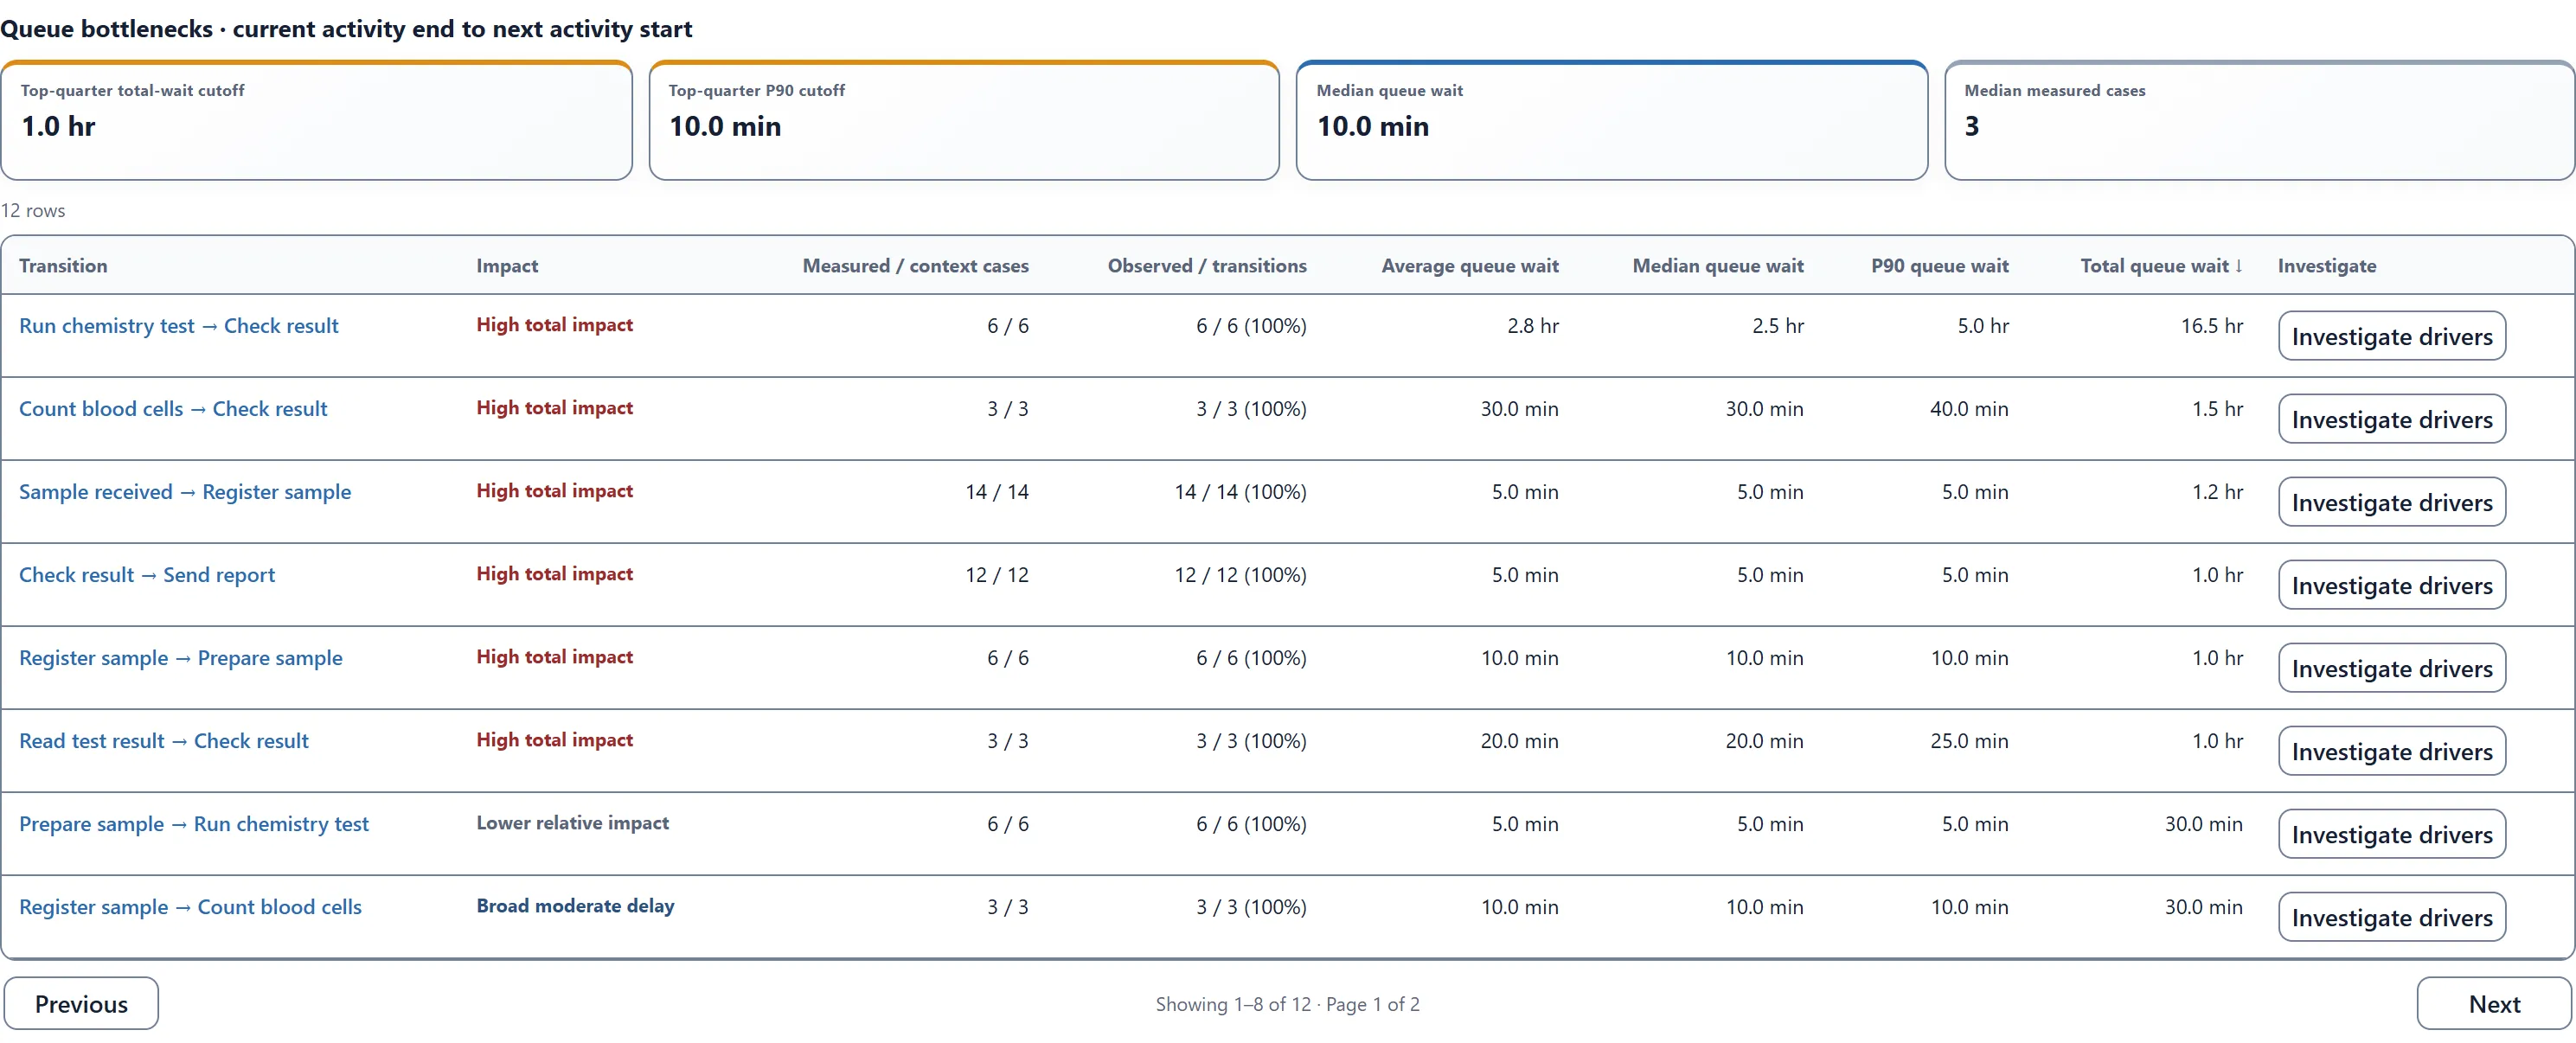
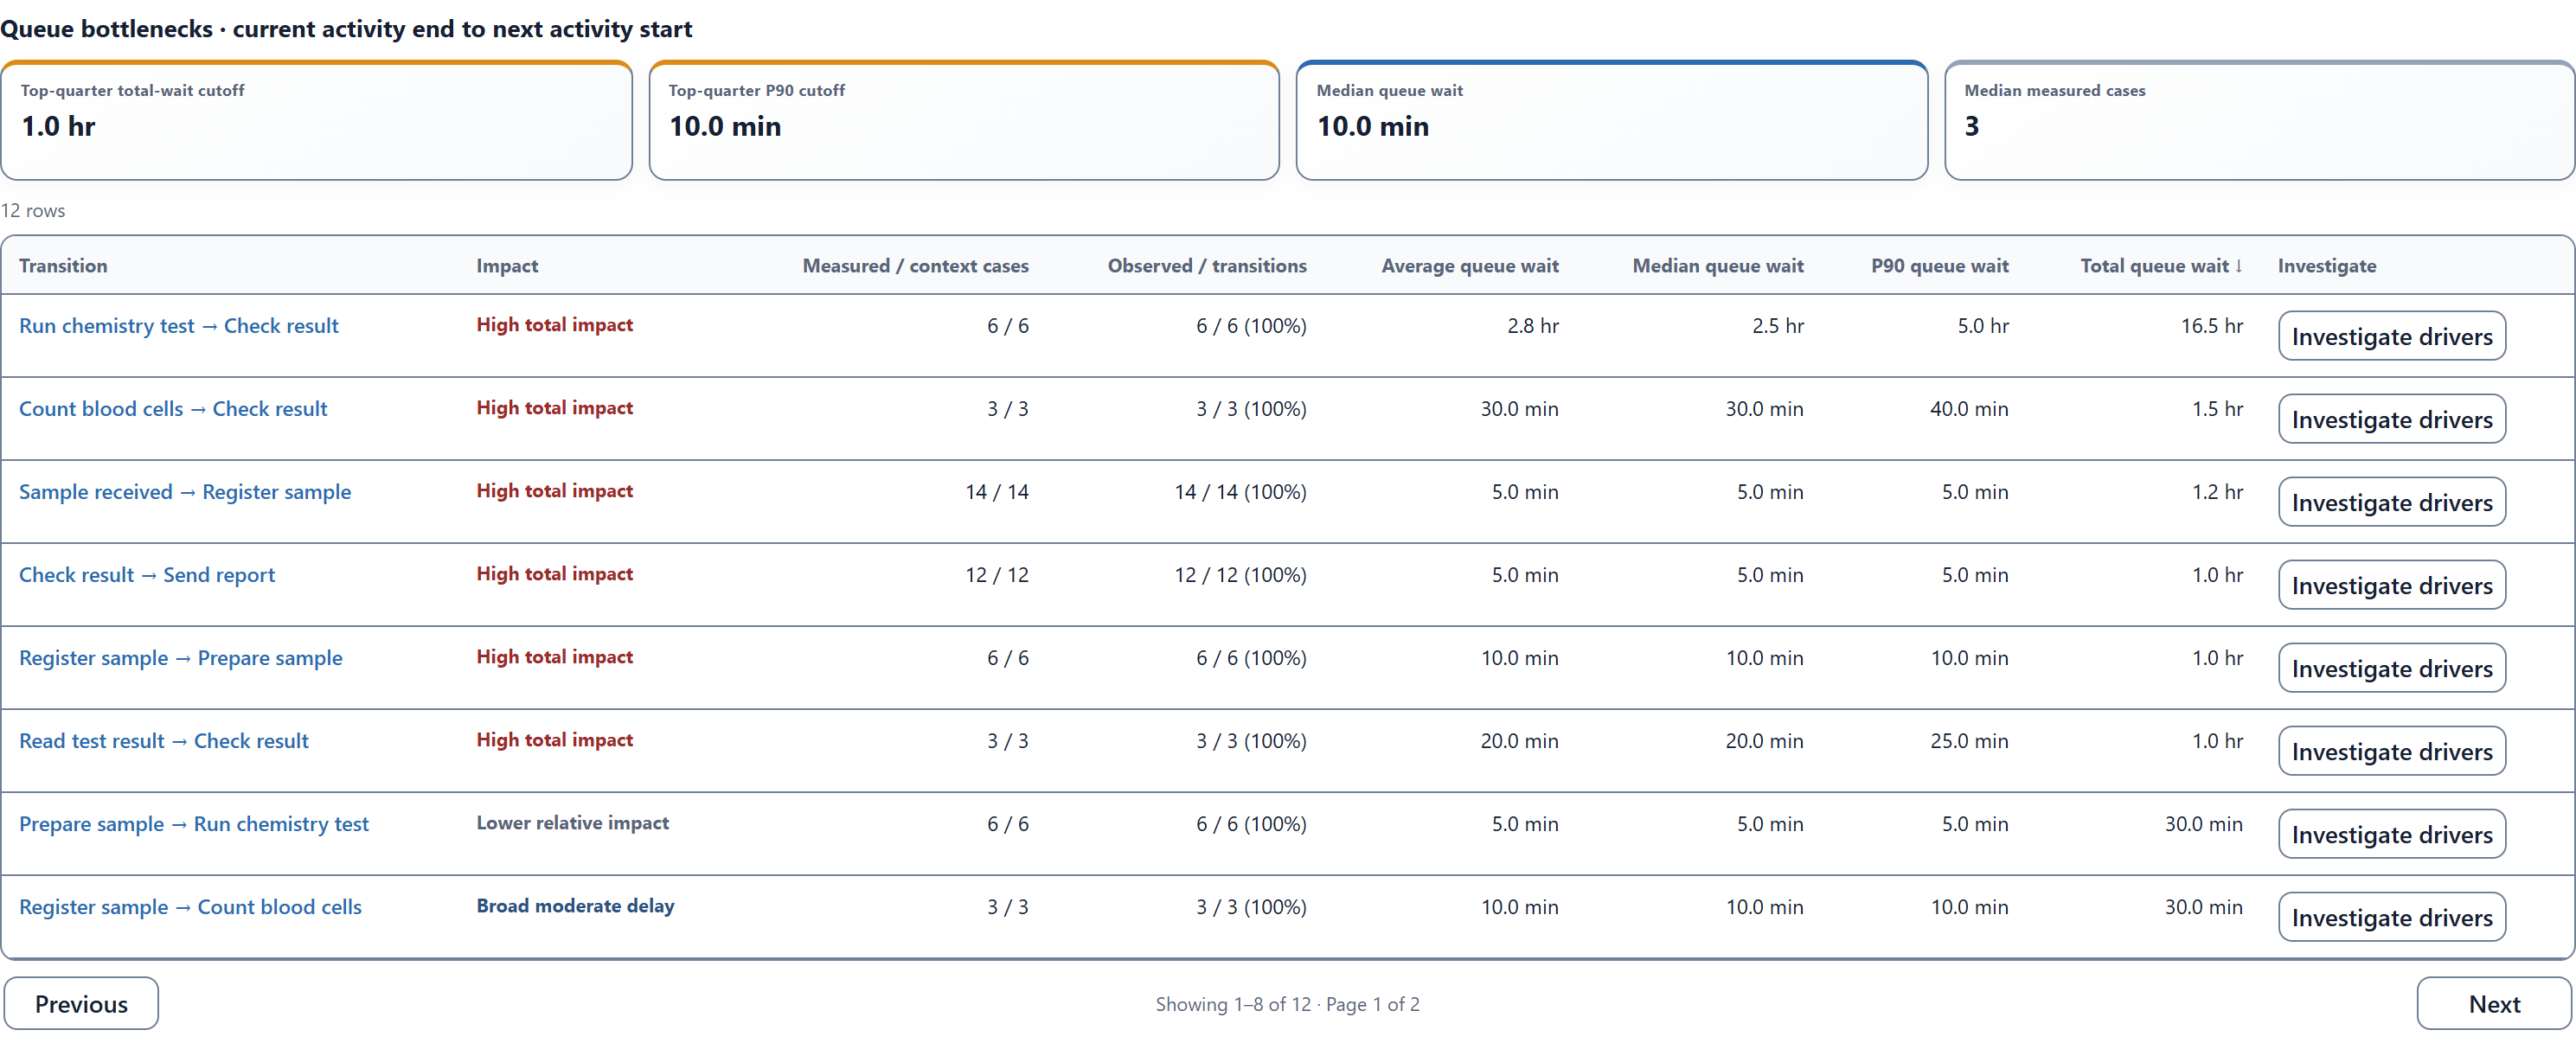
Run chemistry test → Check result has the most waiting time. The six results wait 1, 1.5, 2, 3, 4, and 5 hours. Added together, that is 16.5 hours, shown as 16.5 hr in the table.
That total combines waits from different samples. For example, two samples waiting an hour each contribute two hours to the total, even if they wait at the same time. A large total can come from long waits, many samples, or both.
Here, every chemistry test takes the same 30 minutes, while the wait afterward ranges from one to five hours. That gives us a clear place to start: what happens between finishing the test and starting the result check?
Follow one result through the wait
Select Run chemistry test → Check result in the waiting-time table. Threadseer opens the six samples that went through these steps. Select the LAB-006 Case ID to see each task’s start and finish times.
- 08:50 → 09:20Run chemistry test30 min task time
- 09:20 → 14:20Wait for the result check5 hr waiting time
- 14:20 → 14:30Check result10 min task time
The wait starts when the test finishes at 09:20. It ends when the result check starts at 14:20.
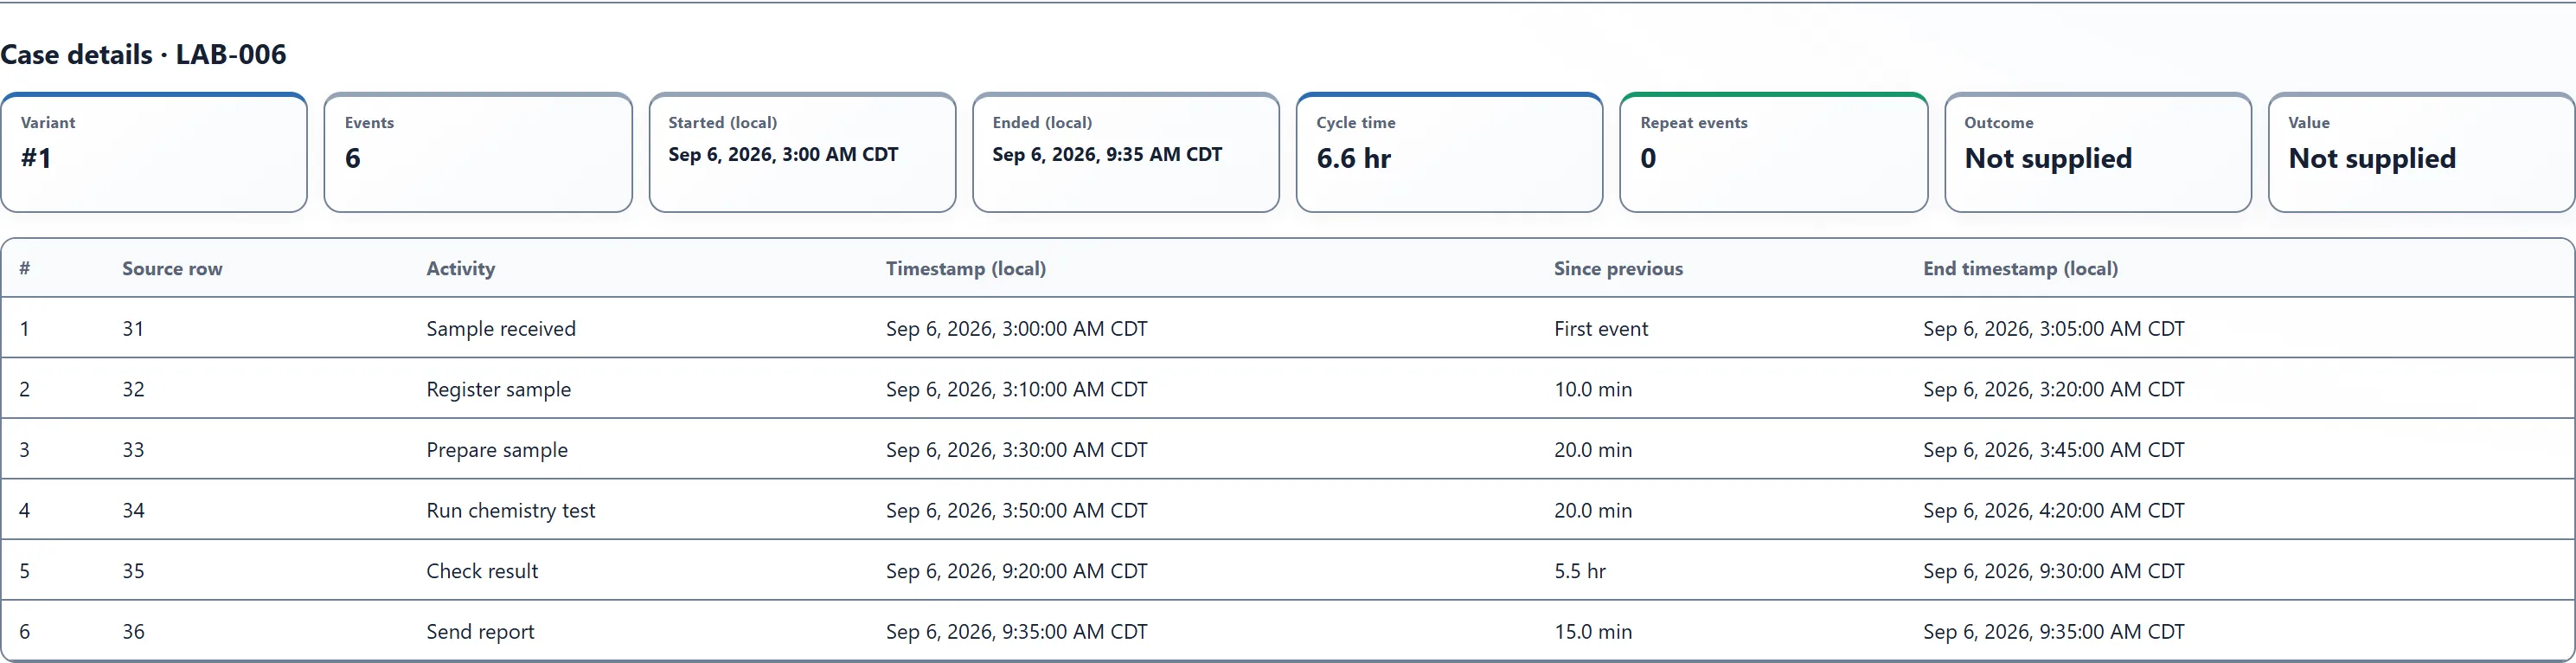
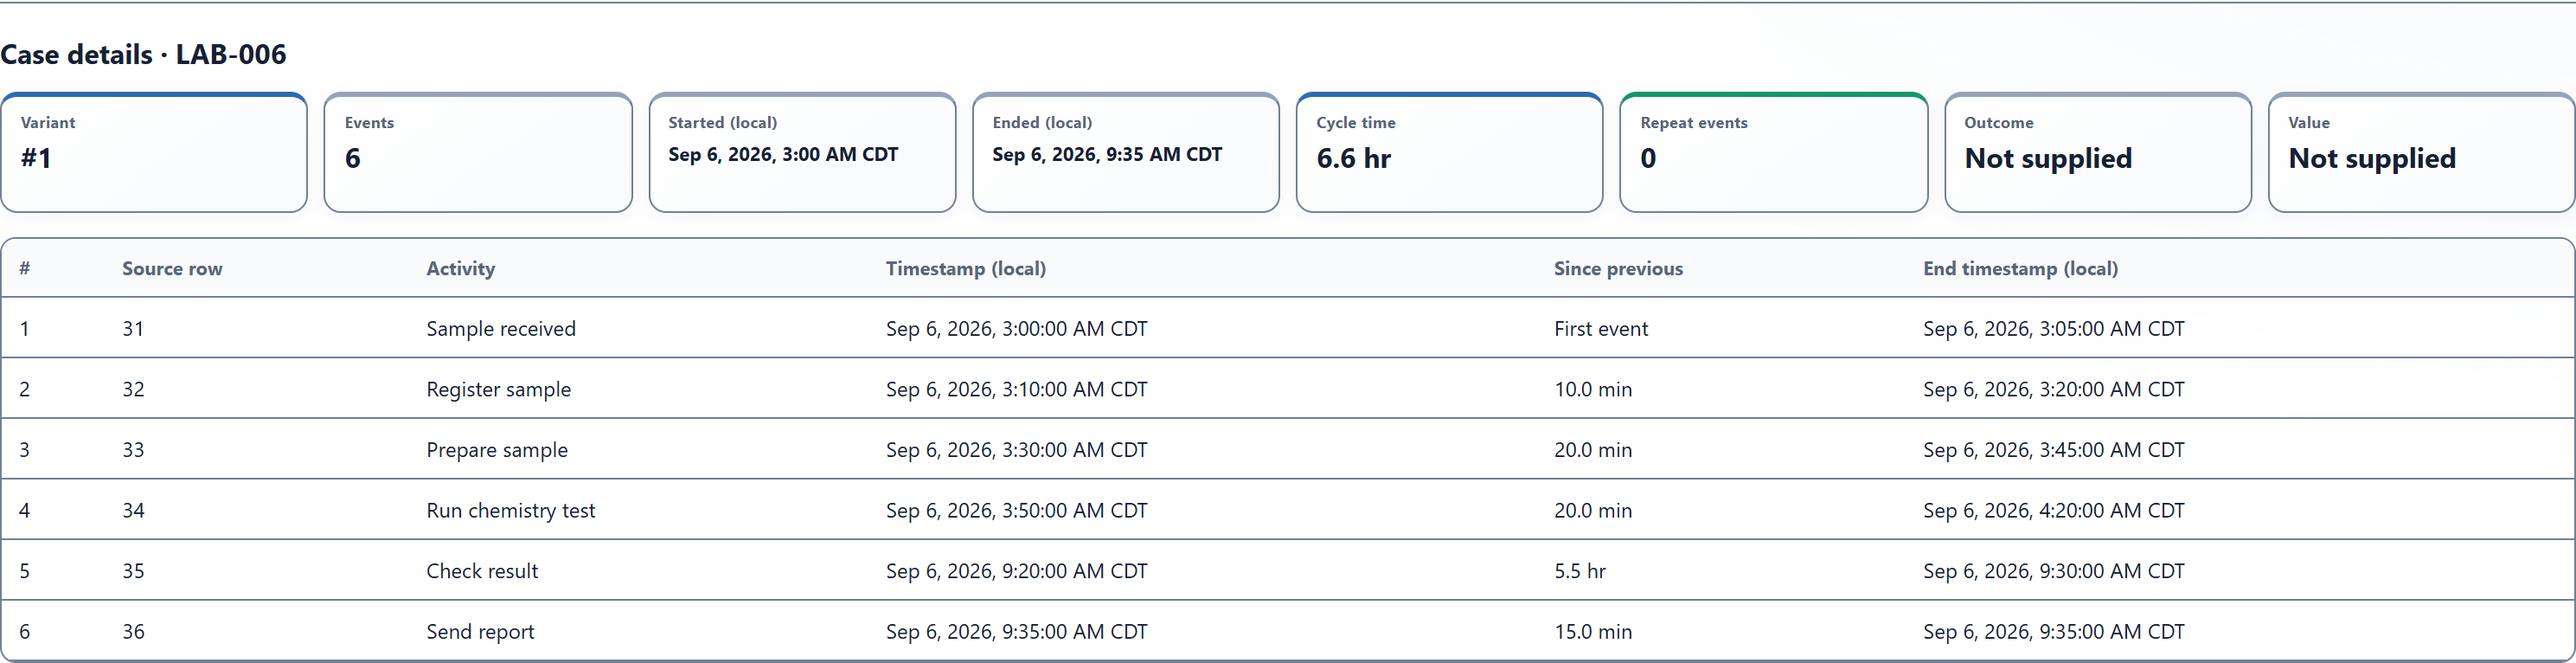
The result check starts at 14:20, and the test finishes at 09:20. The difference is five hours of waiting.
The records also show Since previous: 5.5 hr at Check result. That column starts counting when the previous task starts, so it includes the 30-minute test as well as the five-hour wait. Queue wait starts counting when the test finishes.
Make a short list to investigate
Start with two long waits and one shorter wait for comparison:
| Sample | Test took | Result waited |
|---|---|---|
| LAB-006 | 30 min | 5 hr |
| LAB-005 | 30 min | 4 hr |
| LAB-001 | 30 min | 1 hr |
Ask the team that runs this process: why did some finished results wait longer for a check?
Did the team check results in scheduled batches? Was someone available to review them? Did a separate approval have to happen first? Compare those records for LAB-006, LAB-005, and LAB-001. The shorter wait helps you look for what differed.
If you suspect there were too few people available, check staff schedules and how many results were ready for checking at those times. The waiting-time table identifies where to look; those records help explain what happened.
Before applying this approach to your own data, ask four questions:
- Does “finished” mean ready for the next step? If another approval is required, record that step too.
- Do these tasks follow each other? Tasks happening at the same time can make the next recorded start a poor guide to when work moved on.
- Do the times line up? If the next task starts before the previous one finishes, Threadseer leaves that waiting interval out of its statistics. It keeps a genuine zero-minute wait.
- Was the team operating during the wait? The times include nights and closed hours. Check the work schedule before treating the whole wait as an avoidable delay.
You now have a specific wait to investigate and three samples to discuss with the team. Threadseer shows the timing; the field guide explains how to supply end times for your own records.