

Hierarchical Process Maps in Power BI: A Manufacturing Walkthrough
See which pump builds return for correction, look inside the assembly work, and check the test results with a hierarchical process map in Power BI.
One pump passes its performance test and ships. Another fails, returns to assembly for correction, and passes when tested again. A production manager needs to see that return. An assembly lead needs to see the steps inside it.
A hierarchical process map lets you start with the big picture, then look inside the part that needs attention. Both views use the same build records.
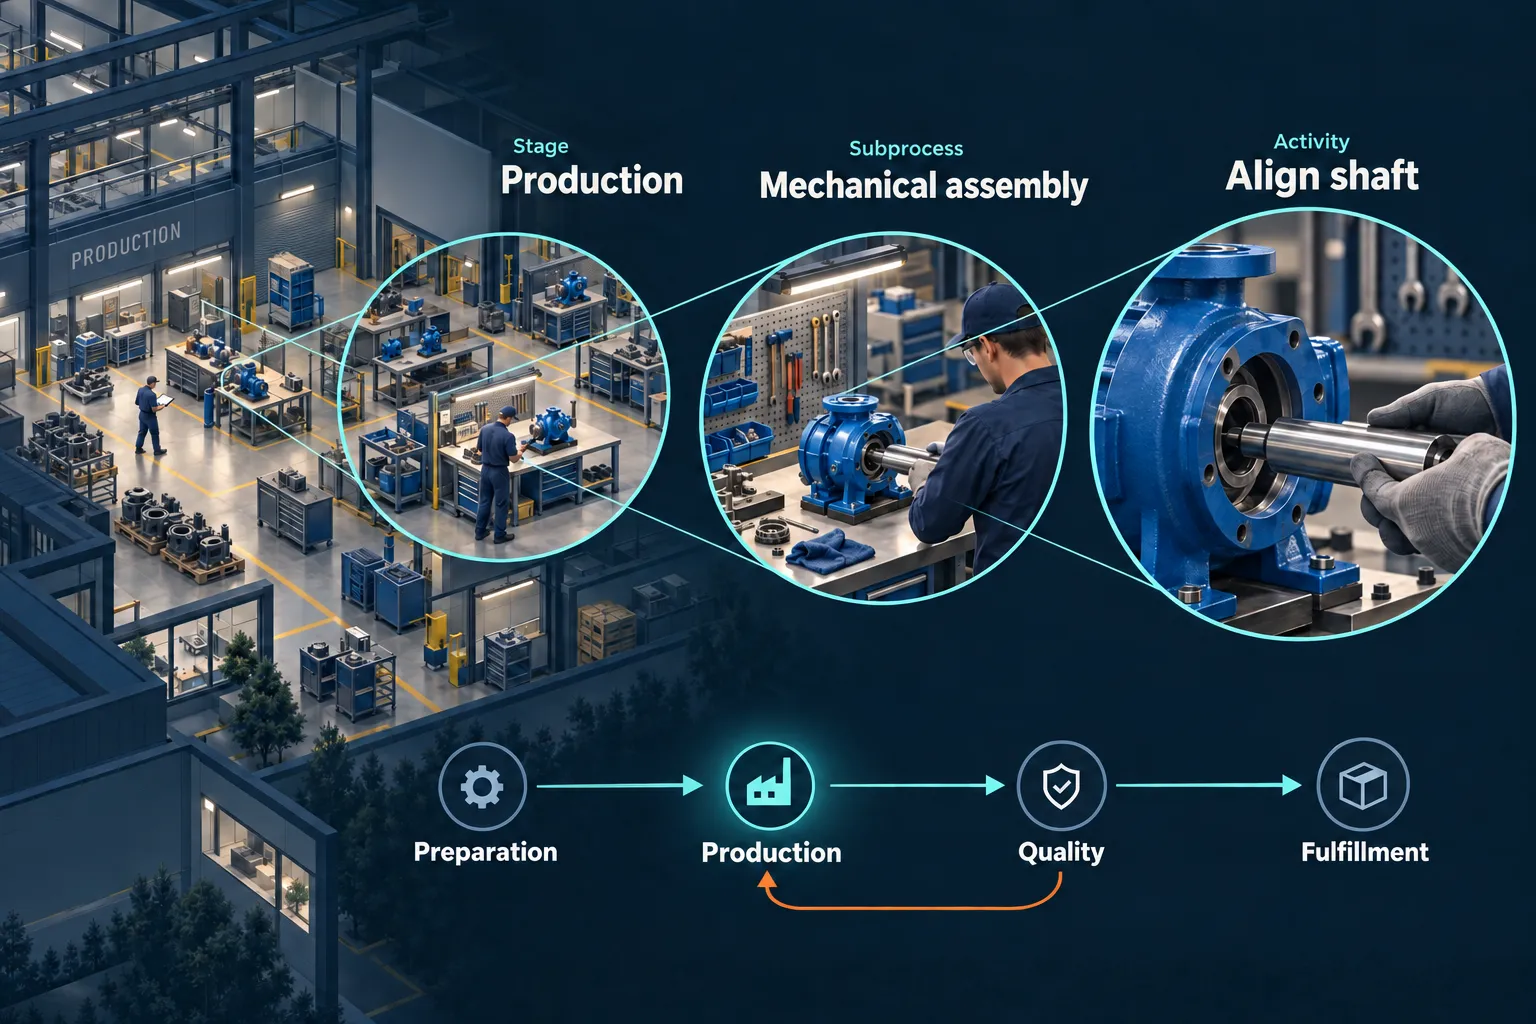
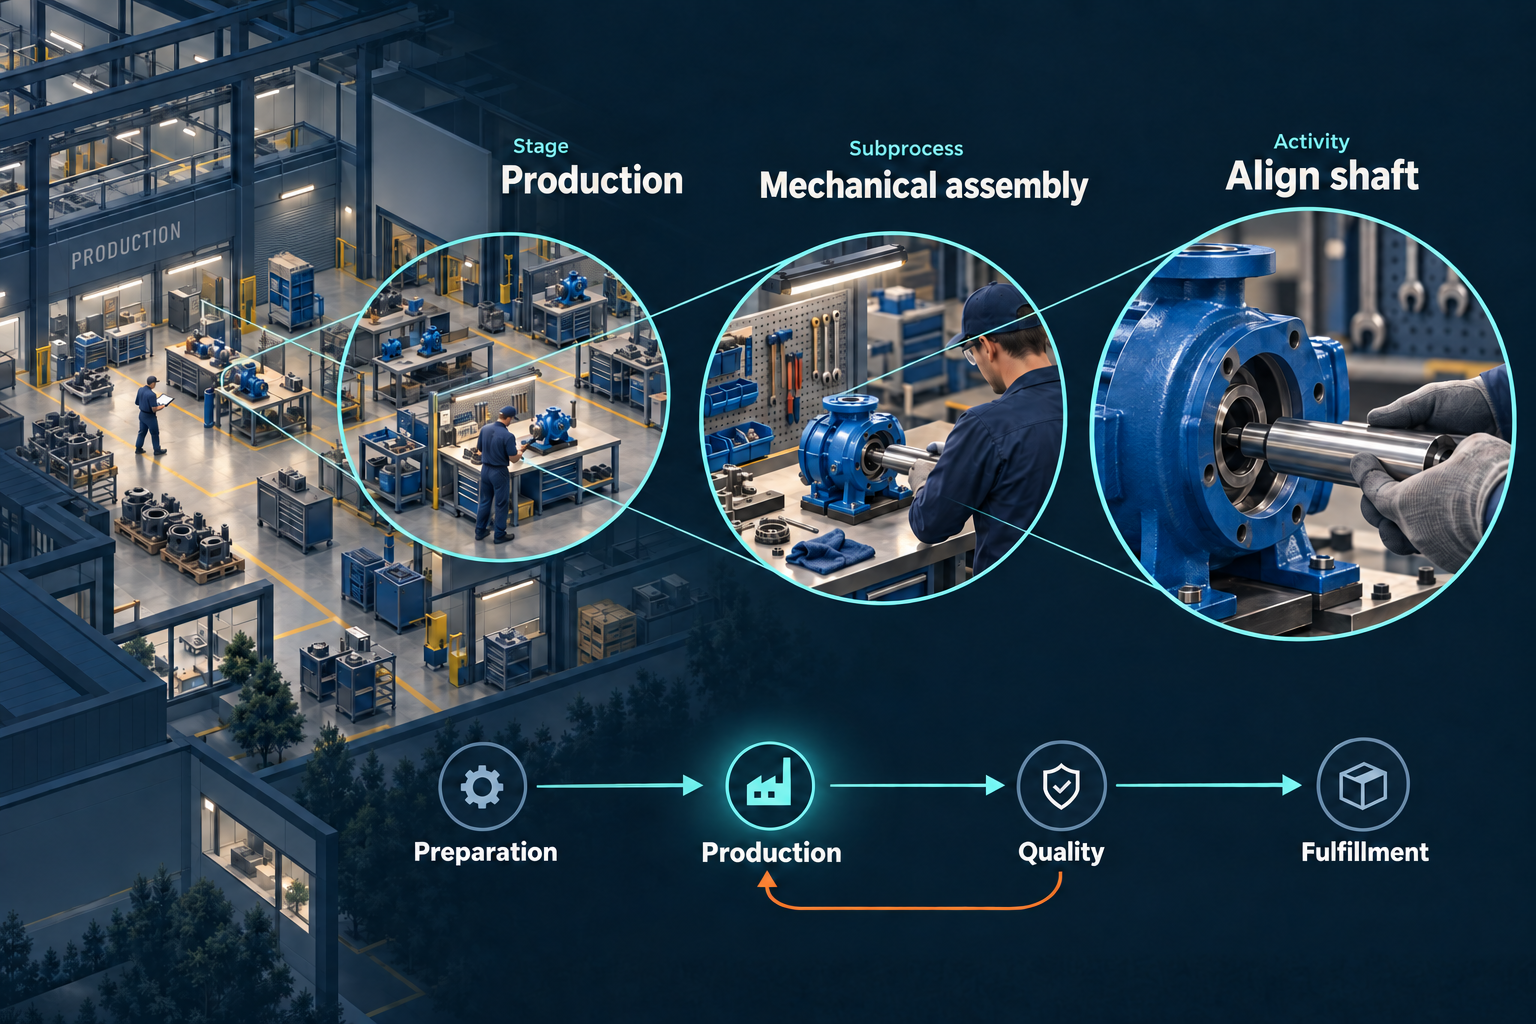
Read the three levels shown
The pump moves through Preparation, Production, Quality, and Fulfillment. Inside Production, the team does mechanical and electrical assembly. Align shaft is one of the mechanical assembly steps. After testing, a pump may return to Production for a correction before being tested again.
We will use Threadseer to answer three questions: Which builds came back to assembly? What work happened there? What do the test records show?
Start with the way the team talks about the work
We will follow 15 build jobs, each producing one industrial pump. Each job keeps the same Build ID through assembly, testing, any correction, and shipping. Threadseer calls each of these builds a case.
The team describes the work at three levels. A stage is a broad part of the process, such as Production. A subprocess is the work inside that stage, such as Mechanical assembly. An activity is one recorded step, such as Align shaft.
- StageProduction
Where is the work happening?
- SubprocessMechanical assembly
What kind of work is it?
- ActivityAlign shaft
What did the team do?
We supply these group names in the data. The map then shows where the builds actually went, using their recorded steps. Two pumps can move through the same stages while needing different work inside assembly.
Open the pump assembly example
Use the first walkthrough’s setup to load the pump assembly CSV into Threadseer. Map Build ID to Case ID, Activity to Activity, and Timestamp to Timestamp. Keep the sample’s timestamps as text when importing; they include an explicit UTC time zone. Then add the two grouping fields below.
Hierarchy is available in Community, and 214 rows fit its 25,000-row analysis limit.
The file also tells us where each step belongs. Connect those two columns to the visual:
- StageWhich business stage? For example, Production.
- Hierarchy 1
- SubprocessWhich part of that stage? For example, Mechanical assembly.
- Activity Category
Leave Hierarchy 2 and Hierarchy 3 empty. Use Don’t summarize where Power BI offers it, and select the Timestamp column rather than Date Hierarchy. Leave Test outcome unmapped; we will check its Failed and Passed values in the CSV later.
Here is where each step belongs in the sample. This table explains the CSV; you only need to import the one file.
| Stage | Subprocess | Activities |
|---|---|---|
| Preparation | Material readiness | Check stock; Reserve components; Pick kit |
| Production | Mechanical assembly | Fit impeller; Assemble casing; Align shaft; Correct alignment |
| Production | Electrical assembly | Install motor; Connect wiring |
| Quality | Product testing | Inspect dimensions; Run performance test; Record test result |
| Fulfillment | Dispatch preparation | Pack pump; Release shipment |
Keep those groupings consistent: Align shaft always belongs to Mechanical assembly, and Mechanical assembly always belongs to Production. Align shaft means lining up the rotating shaft; Fit impeller means installing the part that moves water inside the pump.
Each CSV row records one step. When the readiness screen shows 214 event rows and the required fields are checked, choose Analyze this selection.
See which builds came back to assembly
Open Process Map with View: Standard. To include all 15 builds, set Path scope to Case coverage, Top case coverage to 100%, and Minimum cases to 1. Clear any selected builds or routes. The initial 80% setting leaves out the three builds with an extra alignment step.


Now change View to Hierarchy and View by to Stage. You are still looking at the same 15 builds, but the individual steps are gathered into four stages. The return from Quality to Production is easier to pick out.
An entry counts each time a build enters a stage. The steps recorded while it stays there belong to that entry; coming back later counts again.
Eight builds pass testing directly. Three go through alignment twice before they leave Production, then pass their first test. All 11 move through Preparation → Production → Quality → Fulfillment.
The other four builds come back from Quality to Production, then go through testing again. This is the return we want to investigate.
More work before testing
Align shaft → Align shaft → Install motor
One entry to ProductionThe pump stays in assembly while the team aligns it again.
Back to assembly after testing
Production → Quality → Production → Quality
Two entries to ProductionThe pump goes to testing, then comes back for more work.
The overview combines the first two routes because both move through the same four stages. You see two routes at this level, while the detailed records still contain three different sequences of steps. Opening Production lets you see those differences again.
Look inside the assembly work
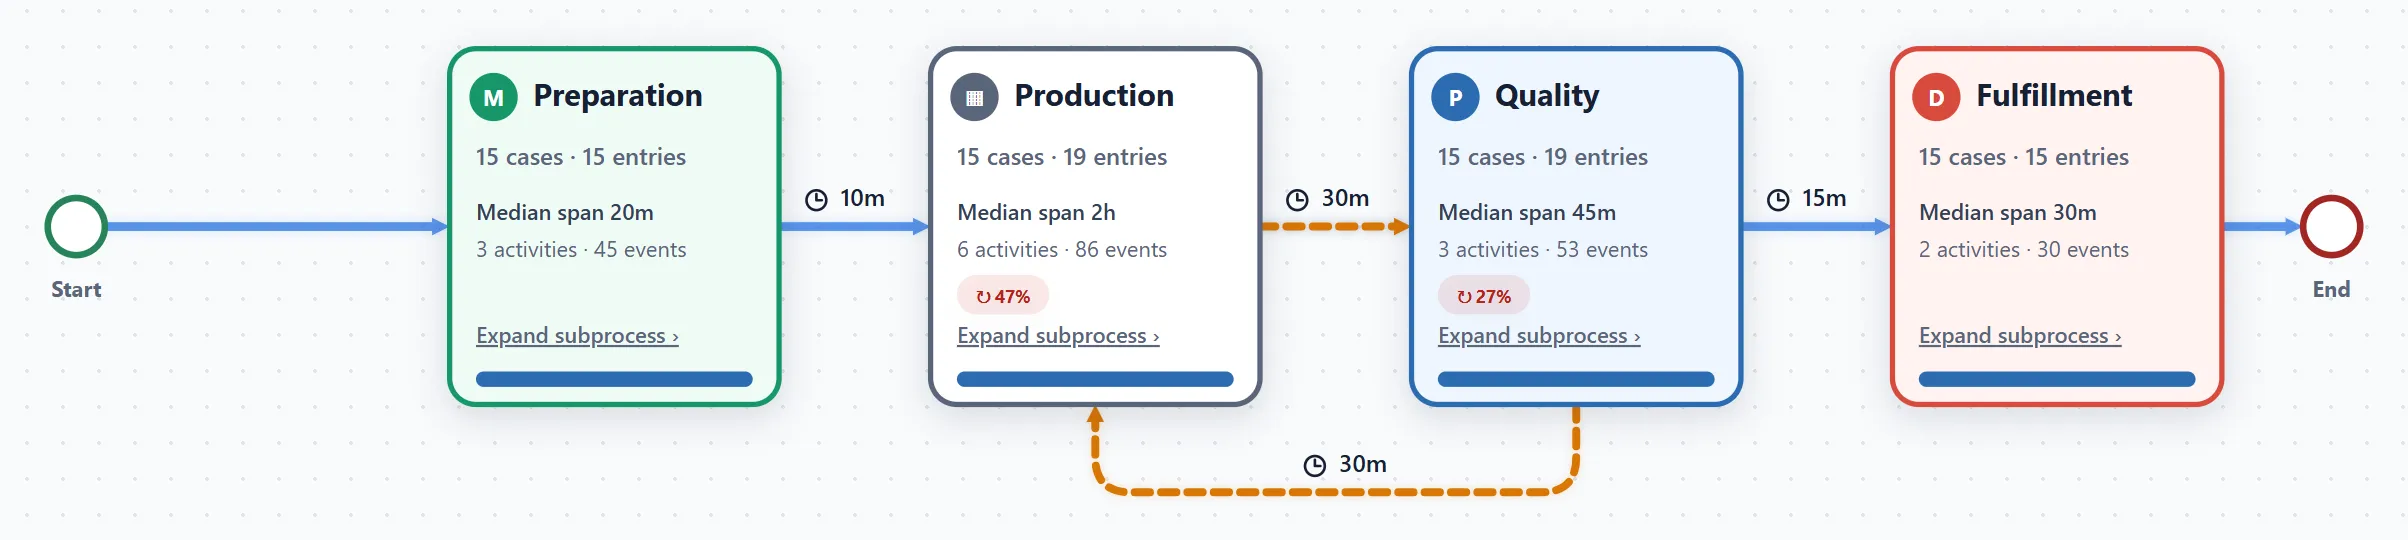
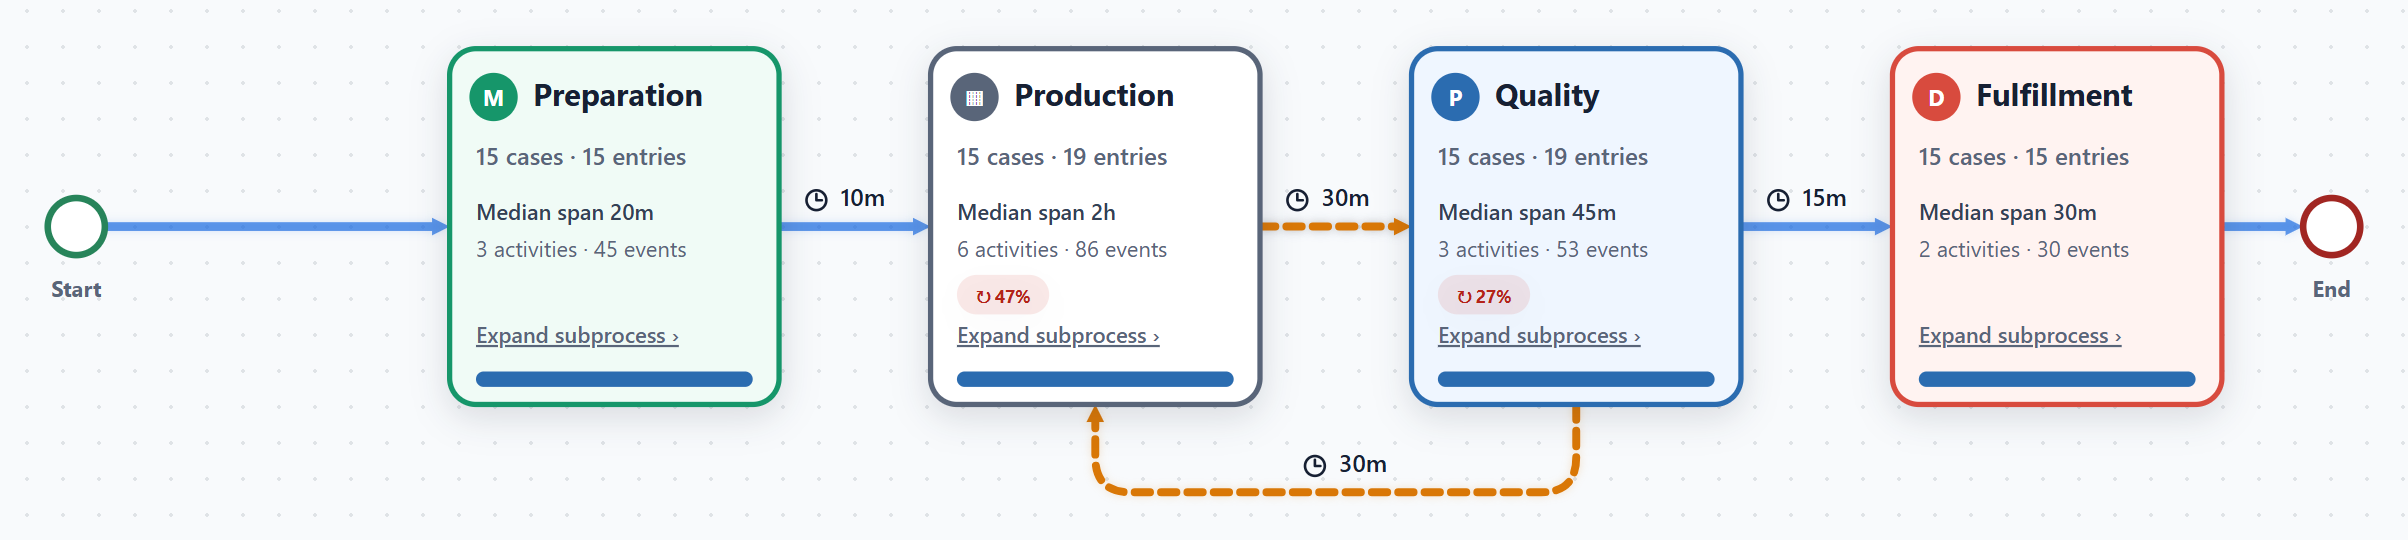
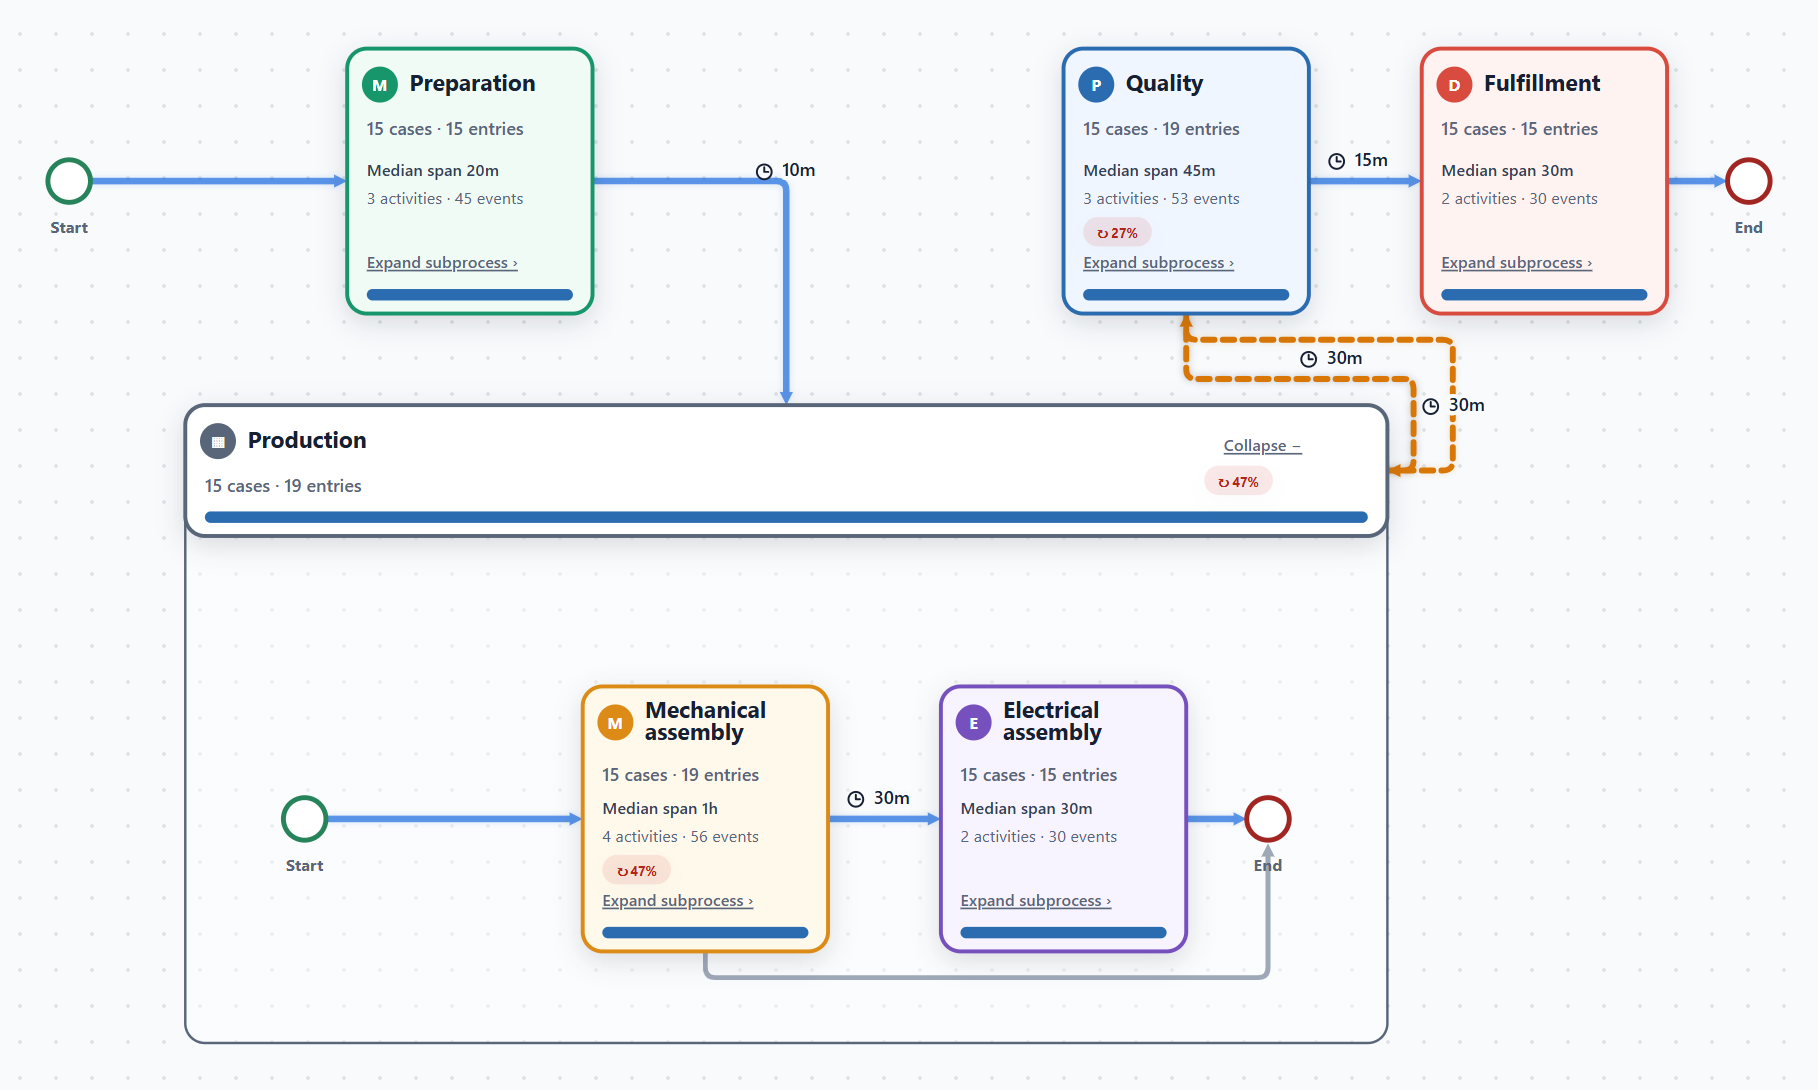
On Production, choose Expand subprocess. You can now see Mechanical assembly and Electrical assembly inside it. The other stages stay closed. Both pictures below show the same 15 builds; opening Production adds detail.
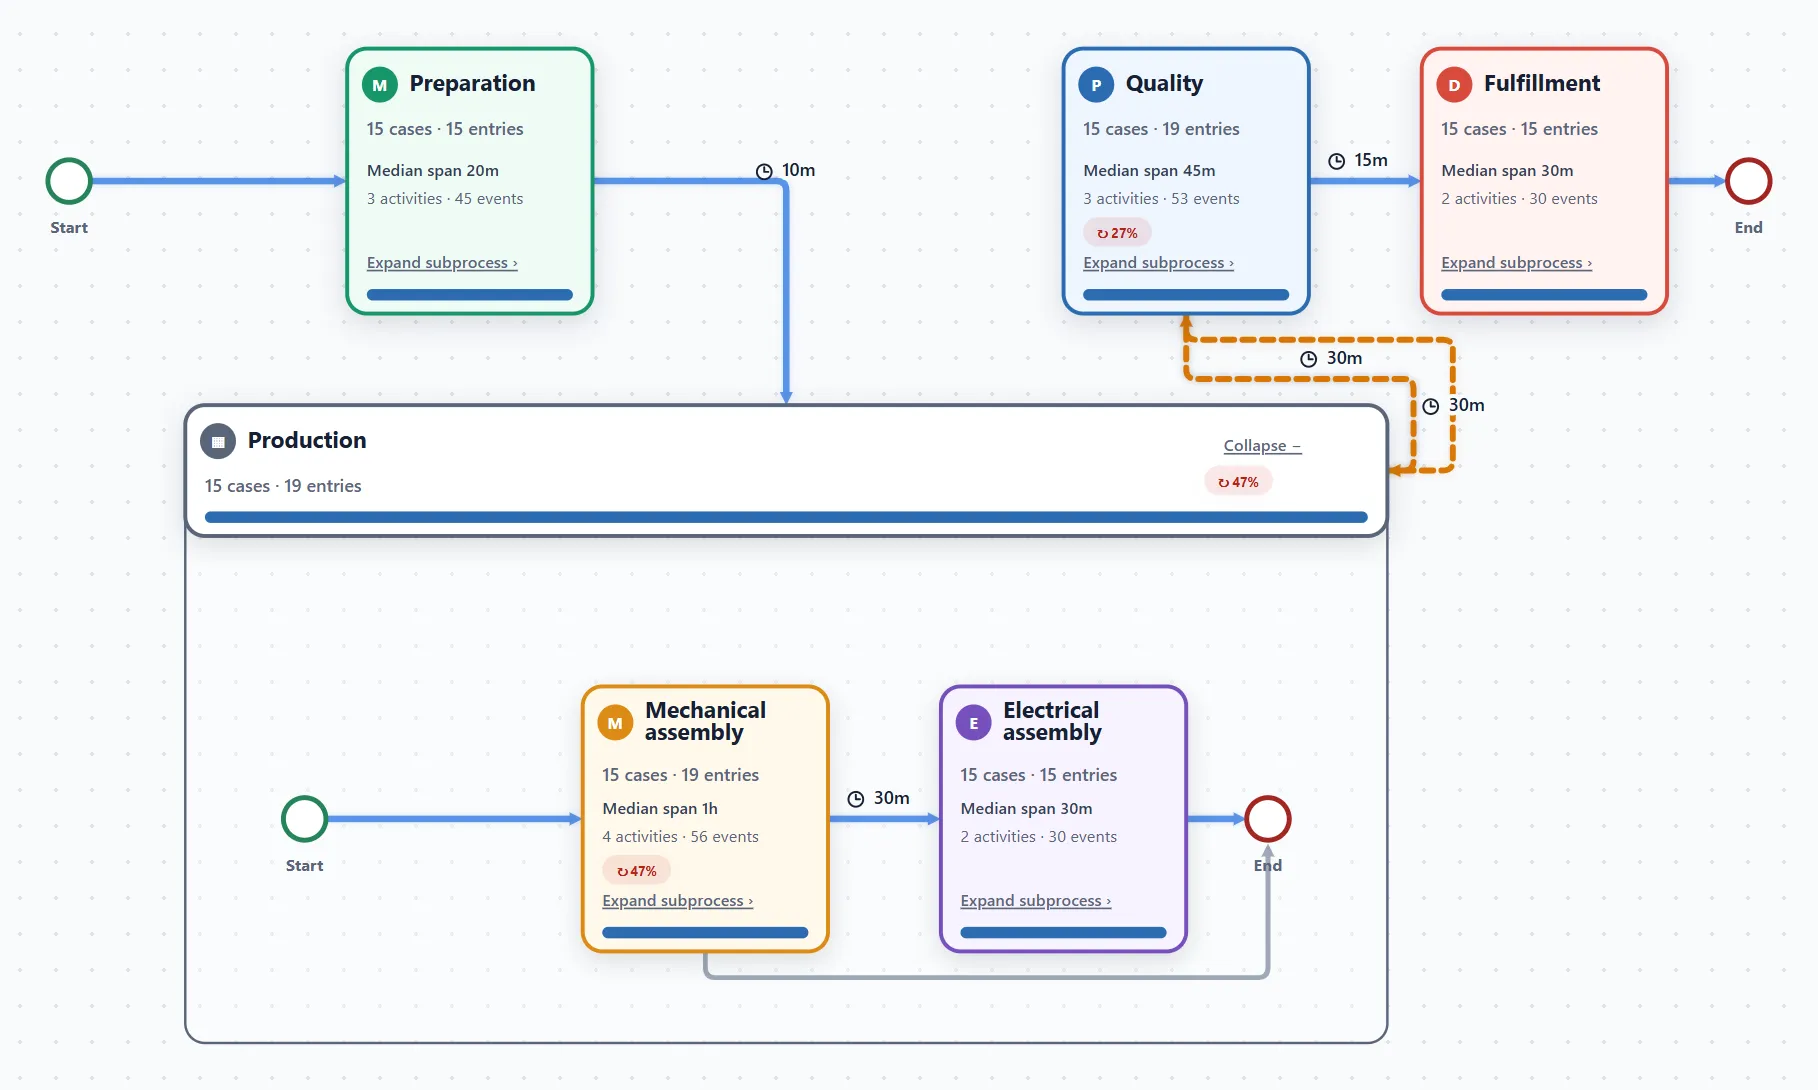
Choose Expand subprocess on Mechanical assembly next. You will see Fit impeller, Assemble casing, Align shaft, and Correct alignment. Now you can find the second alignment that was hidden inside the stage overview.
On an individual step, Entries counts each recorded occurrence. Align shaft has 22 entries across 15 builds because seven builds record it twice.
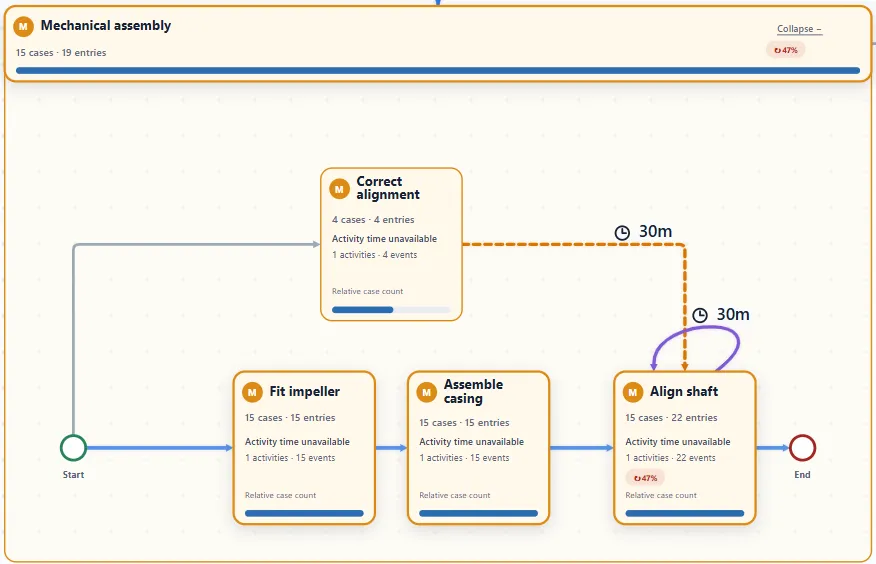
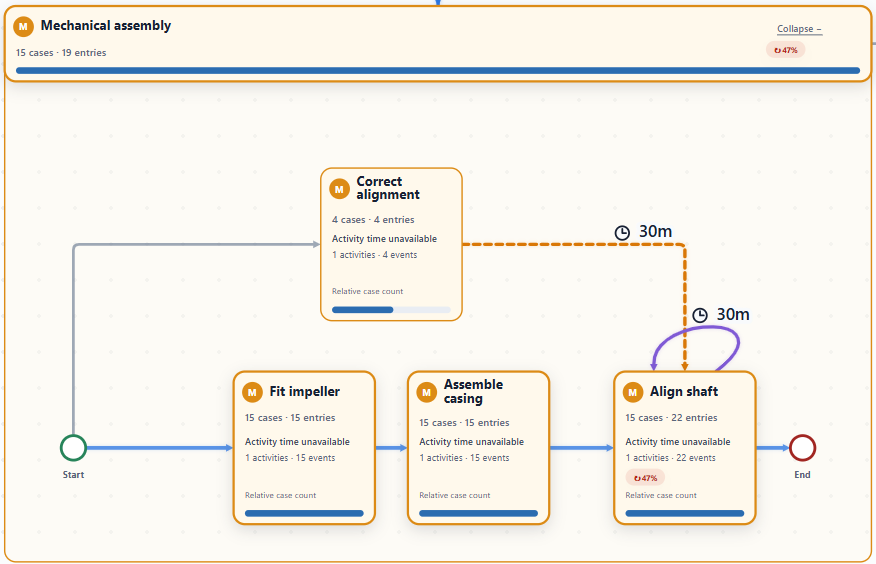
Use Collapse to close an area when you have finished looking inside it, or All groups to return to the stage overview. The links above the map help you move back through the areas you have opened.
Check why one build came back
Four of the 15 builds returned to assembly—about 27%. Start with PUMP-012: open Cases, search for its ID, and select it. Choose Next in the table to reach the testing and correction records on page two.
This build has 17 recorded steps. The six below show the part we care about: a test, a failed result, a correction, and another test. The illustration uses the CSV’s UTC times; your product view may show local times.
- Run performance testQuality · first test
- Record test resultQuality · Failed
- Correct alignmentProduction · correction
- Align shaftProduction · alignment
- Run performance testQuality · second test
- Record test resultQuality · Passed
17 recorded steps in the build2 performance tests6 hr 15 min first to last
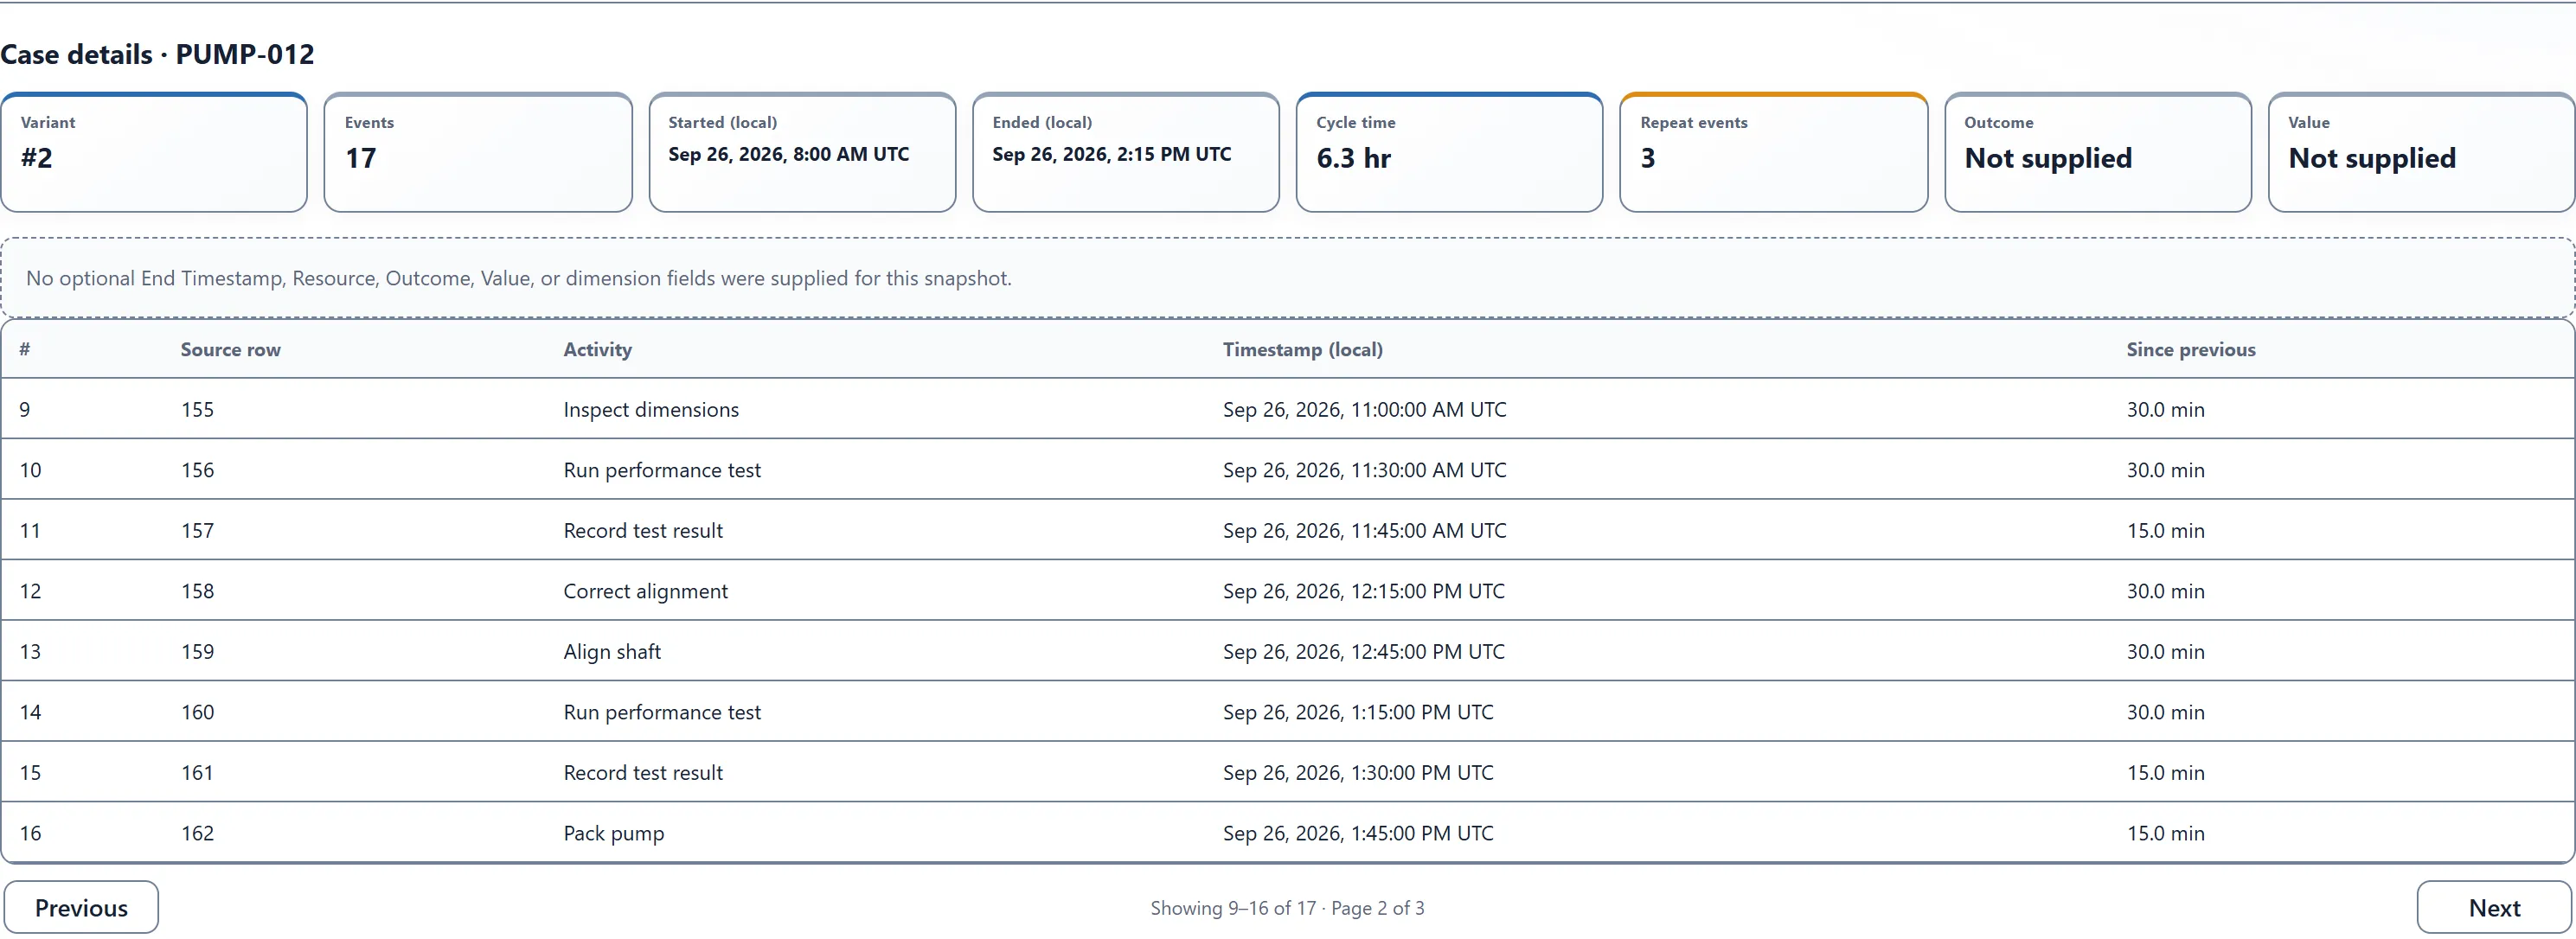
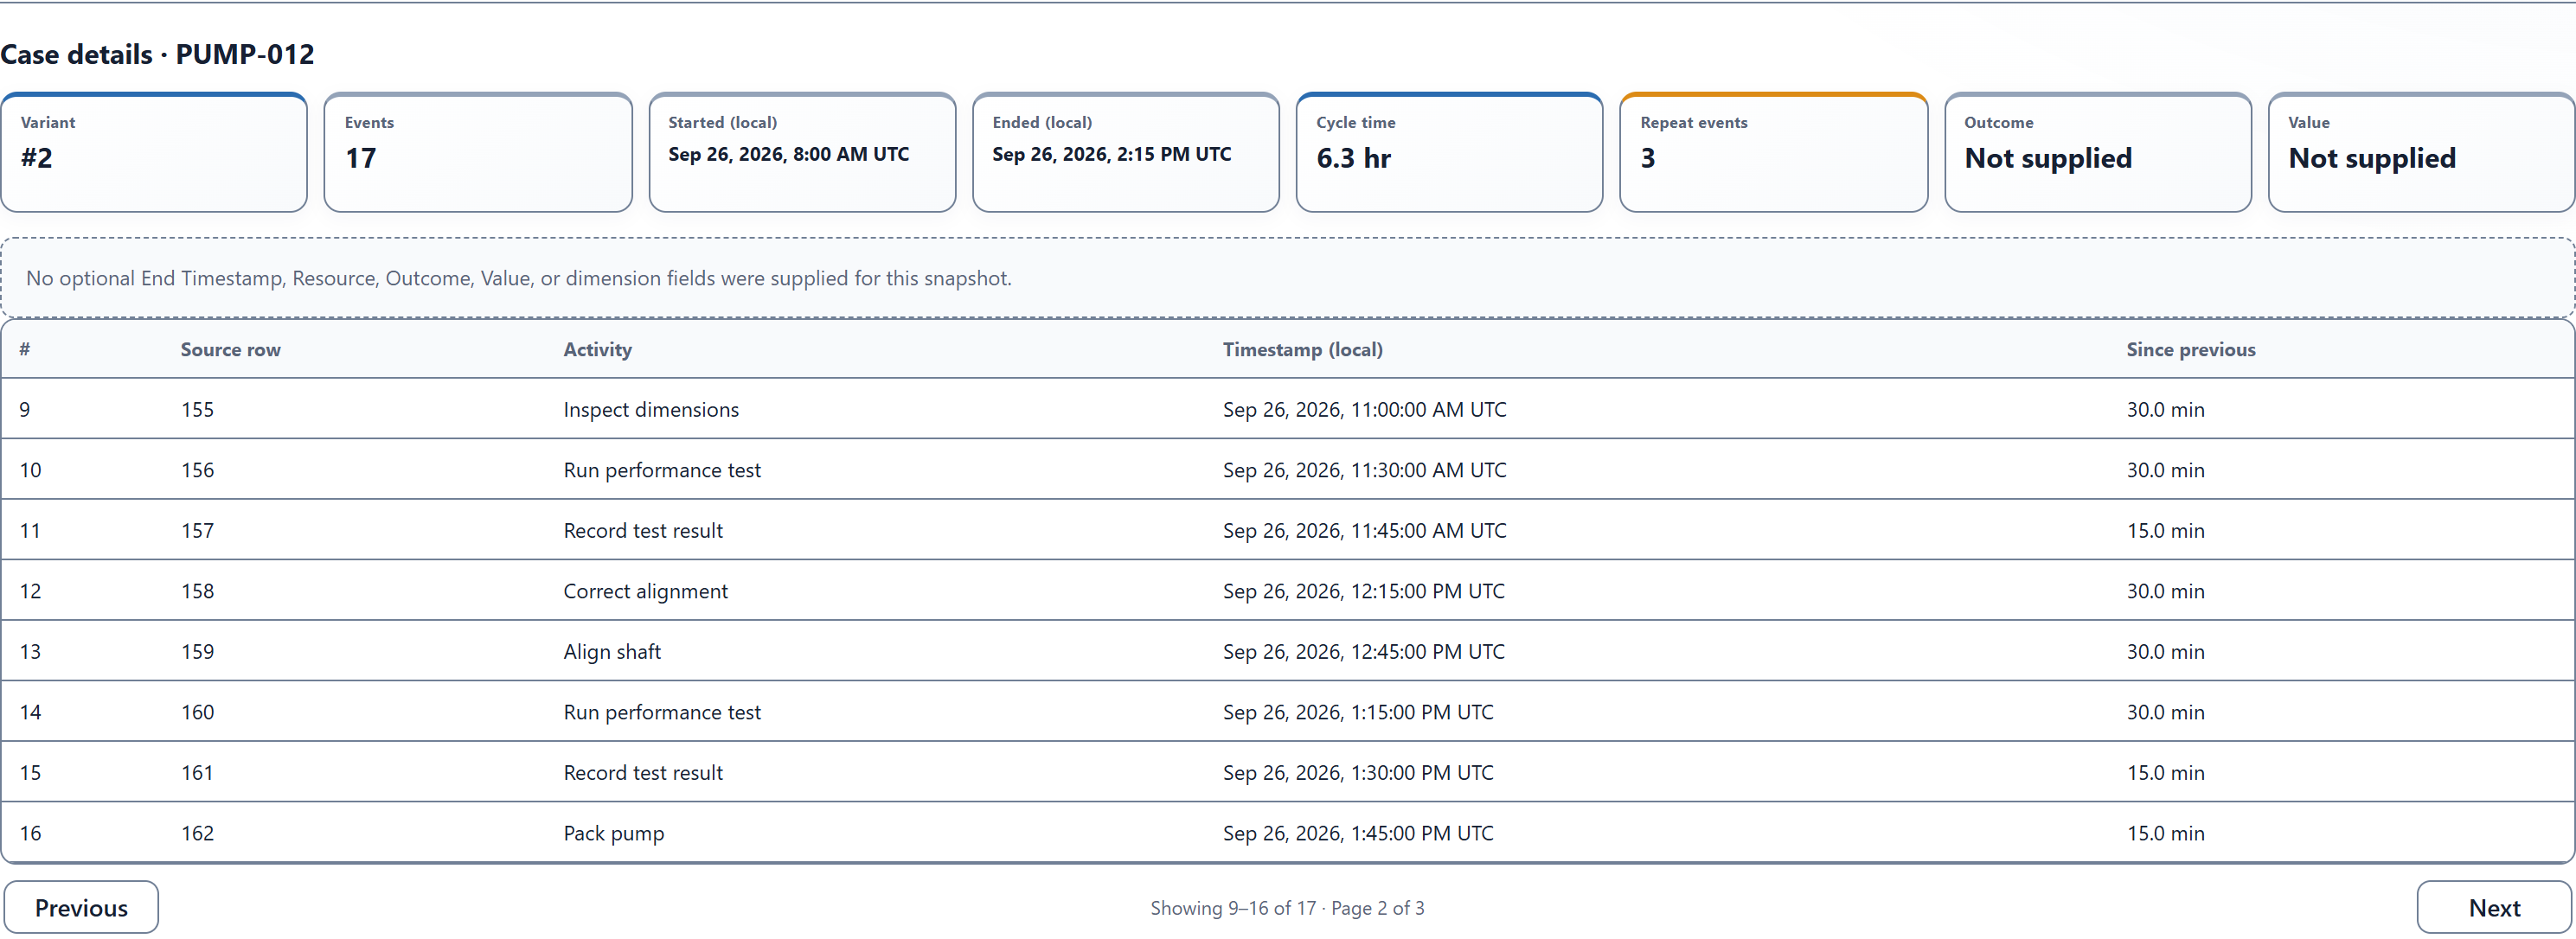
The return arrow cannot tell us whether the test failed. The Failed and Passed values in the CSV can. These rows are from September 26, 2026; the table shows their UTC clock times.
| Build ID | UTC time | Activity | Stage | Subprocess | Test outcome |
|---|---|---|---|---|---|
| PUMP-012 | 11:30 | Run performance test | Quality | Product testing | — |
| PUMP-012 | 11:45 | Record test result | Quality | Product testing | Failed |
| PUMP-012 | 12:15 | Correct alignment | Production | Mechanical assembly | — |
| PUMP-012 | 12:45 | Align shaft | Production | Mechanical assembly | — |
| PUMP-012 | 13:15 | Run performance test | Quality | Product testing | — |
| PUMP-012 | 13:30 | Record test result | Quality | Product testing | Passed |
An em dash means that row has no test result. We can see that this pump failed its first test, had its alignment corrected, then passed the second test. To find out what caused the problem, we would still need the test notes and assembly records.
For comparison, choose Clear selection, search for PUMP-009, and select its ID. The team aligns this pump twice before sending it to testing. It passes its first test and never comes back to assembly. A repeated step does not always mean a failed test.
Read the numbers without losing the story
Choose Clear selection, return to Process Map, and choose All groups to see the full stage overview again.
Production shows 15 cases and 19 entries. There are still only 15 pump builds: four come back, and each return adds another entry.
- Pump builds
- 15Each build counted once.
- Entries to Production
- 19Four builds come back.
- Recorded assembly steps
- 86All the step records in Production.
The 86 events are the individual assembly records. They tell us how many steps were recorded, rather than how many pumps were built.
The 47% rework badge covers seven builds that repeat Align shaft: three before their first test and four after coming back from Quality. Only four failed testing. Use the badge to find work worth checking, then read the records to understand it.
For PUMP-012’s first entry to Production, the assembly records run from 08:30 to 10:30: a two-hour span. After the failed test, its correction records run from 12:15 to 12:45: another 30 minutes. These are two separate entries to Production.
Read the map's time labels and totals
On a stage card, Median span is the middle elapsed time when all entries to that stage are ordered from shortest to longest. Each entry's span runs from its first recorded step to its last. Production's median is two hours; the returning builds' separate entries are counted separately.
With Edge labels: Time, an arrow shows the average gap from the last record in one stage to the first in the next. PUMP-012 has 30 minutes from the failed result at 11:45 to correction at 12:15, then 30 minutes from alignment at 12:45 to retesting at 13:15. Those gaps are 30 minutes for every build taking these arrows in the sample, so their averages are also 30 minutes.
Across the whole map, the 15 builds make 68 stage entries, covering all 214 records. A returning build can enter a stage more than once, so adding entries or stage case counts does not give the number of pumps. The return rate is four out of 15 builds: 26.7%, rounded to 27%.
Returning to a stage does not always repeat the same step. In this example, Correct alignment is new on the return, while Align shaft happens again. The detailed records explain what the return involved.
Try it with a process your team knows
Choose a process with build, order, or job records you can follow from start to finish. Use the broad areas your team already talks about, then group the work inside each area.
- Follow the same job throughout. Keep its ID through corrections and retesting so you can see when it comes back.
- Put each step in one place. Use the same group for Align shaft every time. Ask the team to confirm missing group names and resolve steps assigned to conflicting groups.
- Keep the records in order. Retain repeated steps, use a consistent time zone, and check missing times or steps recorded at the same time in Data Quality. Include complete build histories where possible.
- Check that you are seeing the full picture. Coverage settings, selected builds, and display limits can hide routes. Keep the same builds selected when switching views. Choose Analyze new selection after changing the input data or Power BI filters.
Take PUMP-012 to the assembly and testing leads. Ask what the first test found, what was corrected, and whether the second test checked the same conditions. Compare it with the other three returning builds before deciding whether they need the same follow-up.
You now have a simple overview, the assembly detail behind a return, and a named build to discuss with the team. Use the Threadseer setup guide for your own data, or get Threadseer from Microsoft Marketplace to try this sample.
For more ways to investigate the work, see finding process bottlenecks and comparing process variants.